File:2005 Atlantic hurricane season summary map.png
Size of this preview: 800 × 495 pixels. Other resolutions: 320 × 198 pixels | 640 × 396 pixels | 1,024 × 634 pixels | 1,280 × 792 pixels | 2,560 × 1,585 pixels | 4,000 × 2,476 pixels.
Original file (4,000 × 2,476 pixels, file size: 6.4 MB, MIME type: image/png)
| This is a file from the Wikimedia Commons. Information from its description page there is shown below. Commons is a freely licensed media file repository. You can help. |
| Description |
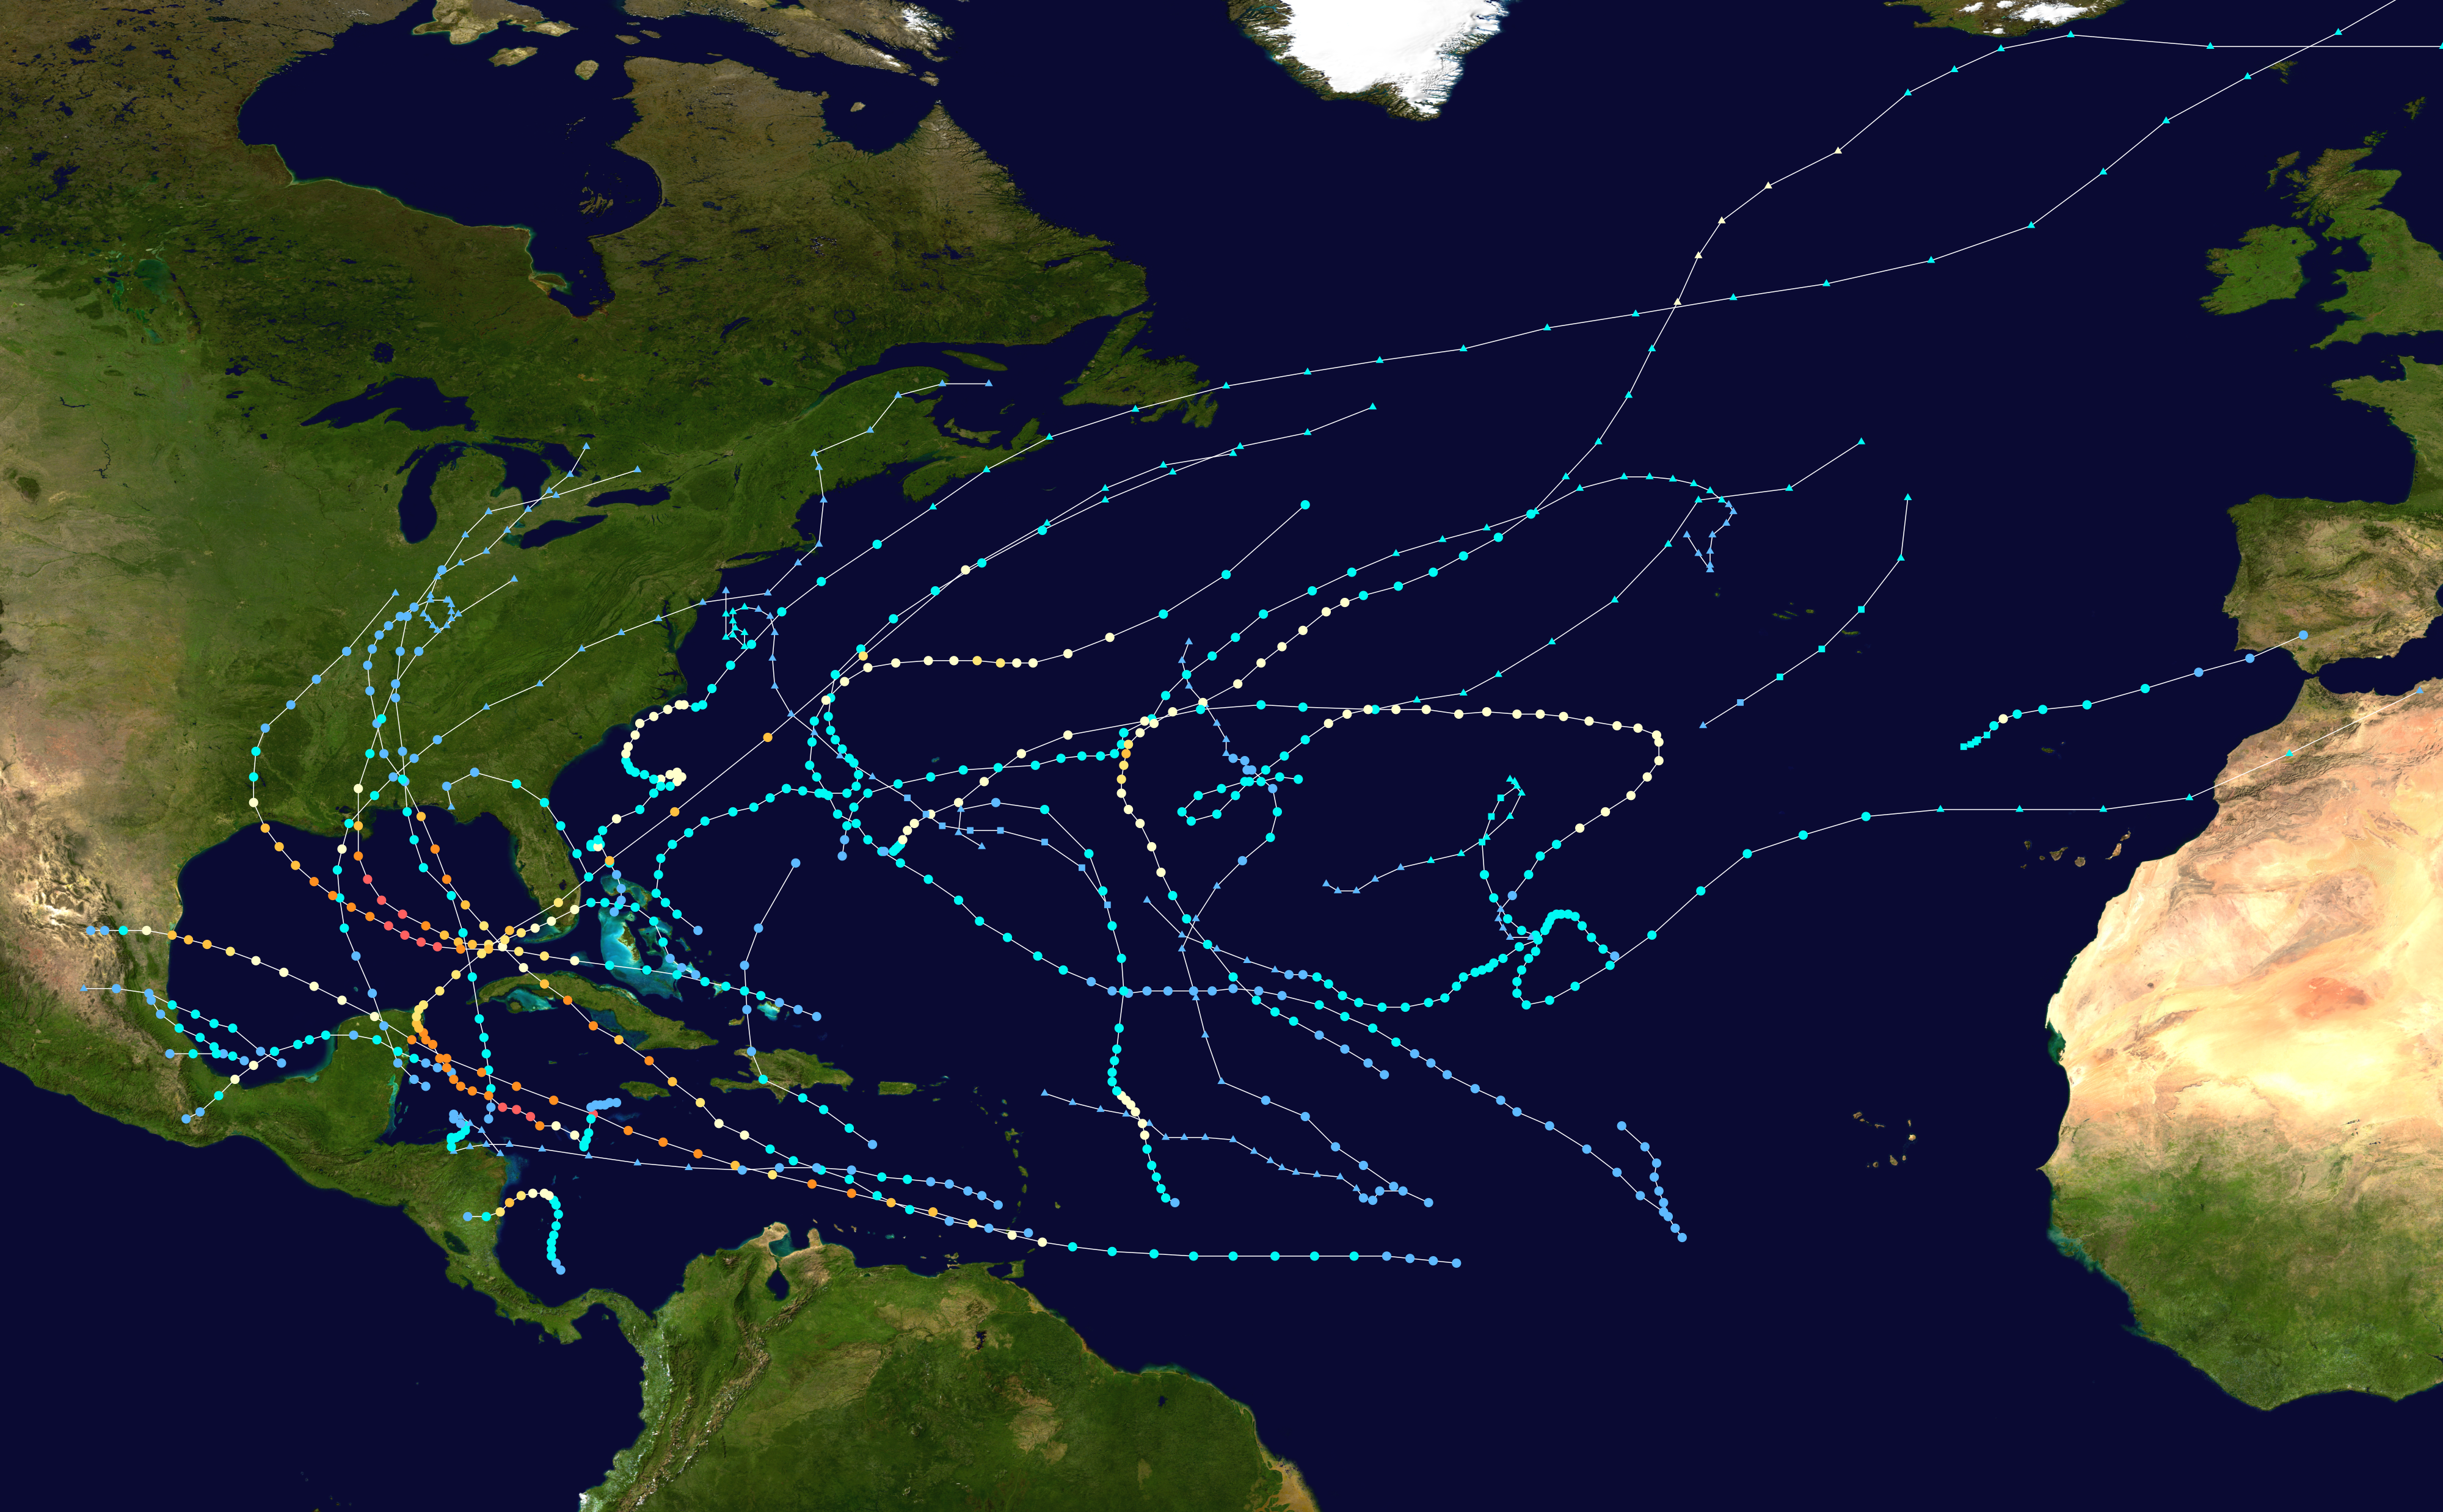
English: This map shows the tracks of all tropical cyclones in the 2005 Atlantic hurricane season. The points show the location of each storm at 6-hour intervals. The colour represents the storm's maximum sustained wind speeds as classified in the Saffir-Simpson Hurricane Scale (see below), and the shape of the data points represent the type of the storm.
Tropical depression (≤38 mph, ≤62 km/h)
Tropical storm (39–73 mph, 63–118 km/h)
Category 1 (74–95 mph, 119–153 km/h)
Category 2 (96–110 mph, 154–177 km/h)
Category 3 (111–129 mph, 178–208 km/h)
Category 4 (130–156 mph, 209–251 km/h)
Category 5 (≥157 mph, ≥252 km/h)
Unknown
Storm type |
| Source | Created using Wikipedia:WikiProject Tropical cyclones/Tracks. The background image is from NASA [1]. The tracking data is from the National Hurricane Center's Atlantic hurricane database |
| Author | Supportstorm |

|
This file may be updated to reflect new information. If you wish to use a specific version of the file without new updates being mirrored, please upload the required version as a separate file. |
| This work has been released into the public domain by its author, Supportstorm. This applies worldwide. In some countries this may not be legally possible; if so: Supportstorm grants anyone the right to use this work for any purpose, without any conditions, unless such conditions are required by law. |
File history
Click on a date/time to view the file as it appeared at that time.
| Date/Time | Thumbnail | Dimensions | User | Comment | |
|---|---|---|---|---|---|
| current | 04:37, 29 November 2019 | | 4,000 × 2,476 (6.4 MB) | Supportstorm | Corrected dimension/ higher res |
| 07:10, 5 October 2019 |  | 3,000 × 1,854 (4.64 MB) | Es204L | Reverted to version as of 19:04, 9 June 2013 (UTC) | |
| 23:06, 10 April 2019 |  | 4,000 × 2,472 (9.29 MB) | Es204L | 2005 b | |
| 04:51, 11 May 2018 |  | 3,000 × 1,854 (4.64 MB) | Liam Betancourt | Back the summary map released on 2013 | |
| 21:10, 13 March 2018 |  | 4,000 × 2,472 (9.29 MB) | HurricaneTyphoon2018 | Dimensions and size added both | |
| 19:04, 9 June 2013 |  | 3,000 × 1,854 (4.64 MB) | Supportstorm | {{Hurricane season auto track map|start=|end=|source=ATL|type=hurricane|basin=Atlantic|year=2005|author=Supportstorm}} |
File usage
The following page uses this file:
Global file usage
The following other wikis use this file:
- Usage on ar.wikipedia.org
- Usage on de.wikipedia.org
- Usage on en.wikipedia.org
- User:Ctrl build
- 2005 Atlantic hurricane season
- User:DDerby
- Hurricane Dennis
- Hurricane Emily (2005)
- Hurricane Katrina
- Hurricane Ophelia (2005)
- Hurricane Rita
- Hurricane Stan
- Tropical Storm Tammy (2005)
- Hurricane Vince
- Timeline of the 2005 Atlantic hurricane season
- Hurricane Wilma
- Tropical Storm Alpha (2005)
- User:Ctrl build/sandbox2
- Template:Hurricane season bar start
- Template:Hurricane season bar button
- Template:Hurricane season bar end
- Template:2005 Atlantic hurricane season buttons
- Hurricane Cindy (2005)
- Tropical Storm Gamma (2005)
- Talk:2005 Atlantic hurricane season/Archive 13
- Hurricane Maria (2005)
- Tropical Storm Arlene (2005)
- Hurricane Irene (2005)
- Tropical Storm Delta (2005)
- Hurricane Nate (2005)
- Tropical Storm Bret (2005)
- Tropical Storm Zeta (2005)
- Tropical Storm Gert (2005)
- Tropical Storm Jose (2005)
- User:WeatherVane/Sandbox
- 2005 Azores subtropical storm
- Meteorological history of Hurricane Wilma
- Hurricane Beta
- User:Cyclonebiskit/Hurricane Rita
- Hurricane Epsilon (2005)
- Tropical cyclones in 2005
- Template:Hurricane season bar start/doc
- Template:Hurricane season bar button/doc
- Template:Hurricane season bar end/doc
- Meteorological history of Hurricane Dennis
- Template:Tropical cyclone timeline/testcases
- Usage on es.wikipedia.org
- Usage on fa.wikipedia.org
- Usage on fr.wikipedia.org
- Usage on hu.wikipedia.org
- Usage on it.wikipedia.org
View more global usage of this file.