File:Binding energy curve - common isotopes.svg

Original file (SVG file, nominally 671 × 441 pixels, file size: 22 KB)
| This is a file from the Wikimedia Commons. Information from its description page there is shown below. Commons is a freely licensed media file repository. You can help. |
Summary
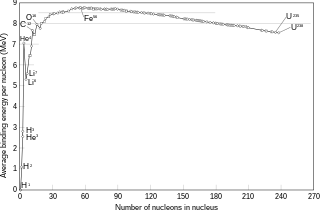
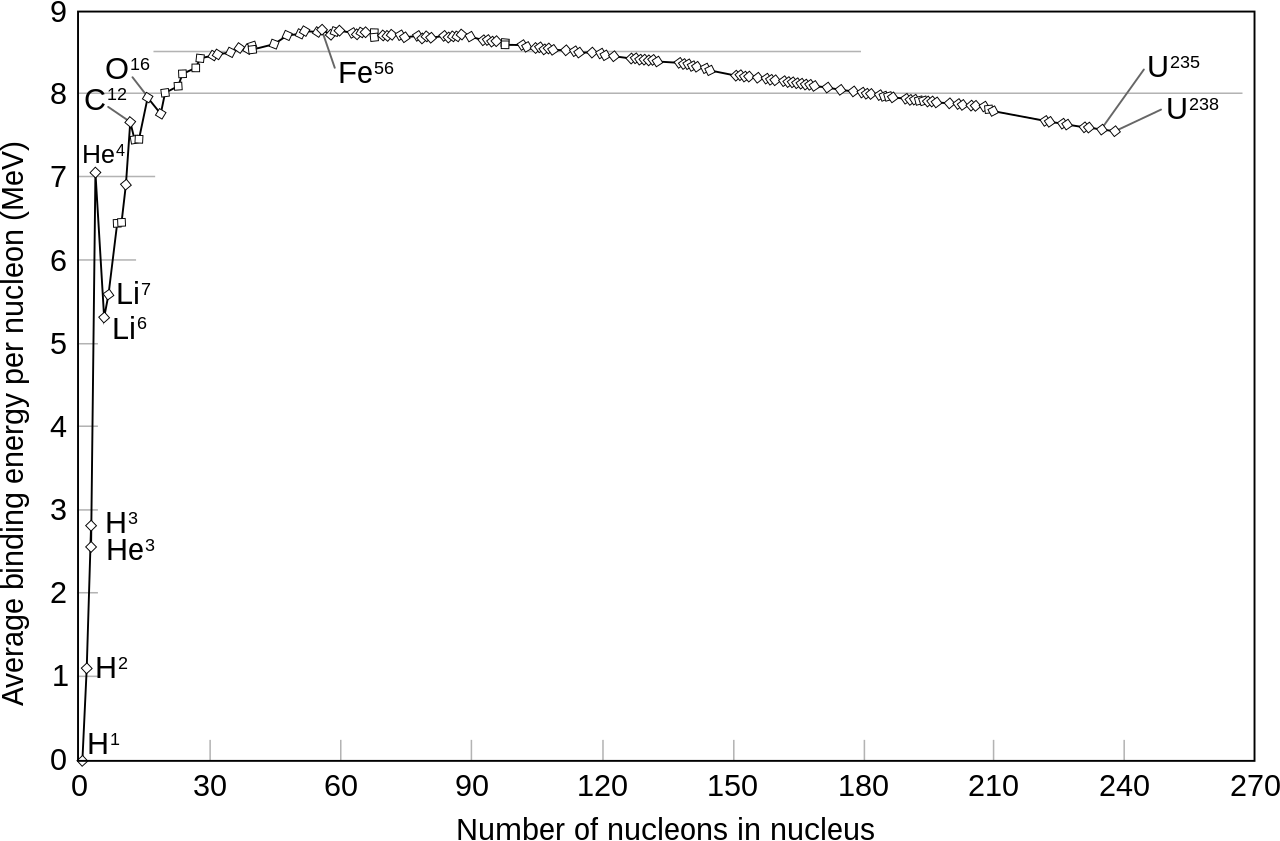
Binding energy curve (average binding energy per nucleon in MeV against number of nucleons in nucleus) for a number of relatively common (abundant) isotopes (not chosen systematically; almost anything with an occurence of over .2 was chosen though a few exceptions are in there, such as U235). A few important ones for the purposes of nuclear fusion and nuclear fission are marked, as well as iron-56, which sits at the highest point on this graph and cannot yield energy from fission (though it can theoretically fuse with hydrogen, deuterium, helium or carbon). (The graph does not have nickel-62, which actually has a higher binding energy than iron-56.)
Data set was taken from here (archived from the original) and the exact set used to generate this graph has been posted to this talk page.
Created in Excel, exported to Adobe Illustrator, exported to Inkscape, and rendered into this graph, by User:Fastfission.
Licensing
| This work has been released into the public domain by its author, Fastfission. This applies worldwide. In some countries this may not be legally possible; if so: |
If you want to credit someone, credit "Wikimedia Commons." Otherwise don't credit anyone, that's fine by me. --Fastfission 15:01, 14 April 2008 (UTC)

|
This SVG file contains embedded text that can be translated into your language, using any capable SVG editor, text editor or the SVG Translate tool. For more information see: About translating SVG files. |
derivative works
[]
SVG:
-
 German
 -
 English
 -
 Spanish
 -
 Finnish
 -
 French
 -
 Indonesian
 -
 Russian
 -
 Turkish
 -
 Ukrainian
 -
 Arabic


JPG:
-
 English

File history
Click on a date/time to view the file as it appeared at that time.
| Date/Time | Thumbnail | Dimensions | User | Comment | |
|---|---|---|---|---|---|
| current | 11:30, 15 March 2022 | | 671 × 441 (22 KB) | Jlabwiki | File uploaded using svgtranslate tool (https://svgtranslate.toolforge.org/). Added translation for fr. |
| 09:18, 7 September 2020 |  | 671 × 441 (21 KB) | Xorx | File uploaded using svgtranslate tool (https://svgtranslate.toolforge.org/). Added translation for de. | |
| 08:17, 27 February 2020 |  | 671 × 441 (20 KB) | Cbliu | File uploaded using svgtranslate tool (https://tools.wmflabs.org/svgtranslate/). Added translation for zh. | |
| 09:59, 23 August 2019 |  | 671 × 441 (20 KB) | Arnaugir | File uploaded using svgtranslate tool (https://tools.wmflabs.org/svgtranslate/). Added translation for ca. | |
| 12:43, 19 September 2012 |  | 671 × 441 (18 KB) | Palosirkka | Scrubbed with http://codedread.com/scour/ | |
| 13:08, 8 August 2012 |  | 671 × 441 (42 KB) | JWB | extend hash marks and add 8.5 | |
| 15:22, 8 November 2009 |  | 671 × 441 (42 KB) | Autiwa | j'ai supprimé les lignes vides, rejoint tous les traits pour faire une seule courbe,et viré les ronds pour rajouter un style de points à l'intérieur même de la ligne, aisément modifiable. Ainsi le fichier prend beaucoup moins de place et est plus pr | |
| 14:33, 8 November 2009 |  | 698 × 466 (612 KB) | Fastfission~commonswiki | fix metadata, fonts | |
| 14:14, 8 November 2009 |  | 698 × 466 (612 KB) | Fastfission~commonswiki | restore axis (you don't change the axes on graphs based on their values!), fix fonts, update metadata | |
| 21:32, 2 October 2009 |  | 698 × 466 (612 KB) | JWB | Move x axis scale to top for easier comparison since most data points are at top |
File usage
The following page uses this file:
Global file usage
The following other wikis use this file:
- Usage on af.wikipedia.org
- Usage on ar.wikipedia.org
- Usage on ast.wikipedia.org
- Usage on az.wikipedia.org
- Usage on be-tarask.wikipedia.org
- Usage on bs.wikipedia.org
- Usage on ca.wikipedia.org
- Usage on cs.wikipedia.org
- Usage on da.wikipedia.org
- Usage on el.wikipedia.org
- Usage on en.wikipedia.org
- Atom
- Helium
- Nuclear fusion
- Nuclear fission
- Stable nuclide
- Fusion power
- Alpha process
- Silicon-burning process
- Abundance of the chemical elements
- Helium-4
- Talk:Decay chain
- Nuclear fuel
- Nuclear binding energy
- Iron-56
- Portal:Nuclear technology
- Talk:Nuclear power/Archive 10
- Iron peak
- Atomic mass
- Wikipedia:Graphics Lab/Image workshop/Archive/Jan 2009
- Iron group
- User:Kazkaskazkasako/Books/Physical sciences
- Wikipedia:Reference desk/Archives/Science/2016 August 31
- User:Martyn12345678901/sandbox
- User:Tbw121/sandbox
- User:MH0706/Alpha process
- Usage on en.wikibooks.org
View more global usage of this file.