File:Regression pic assymetrique.gif

Regression_pic_assymetrique.gif(610 × 460 pixels, file size: 22 KB, MIME type: image/gif, looped, 10 frames, 5.0 s)

Summary

Description
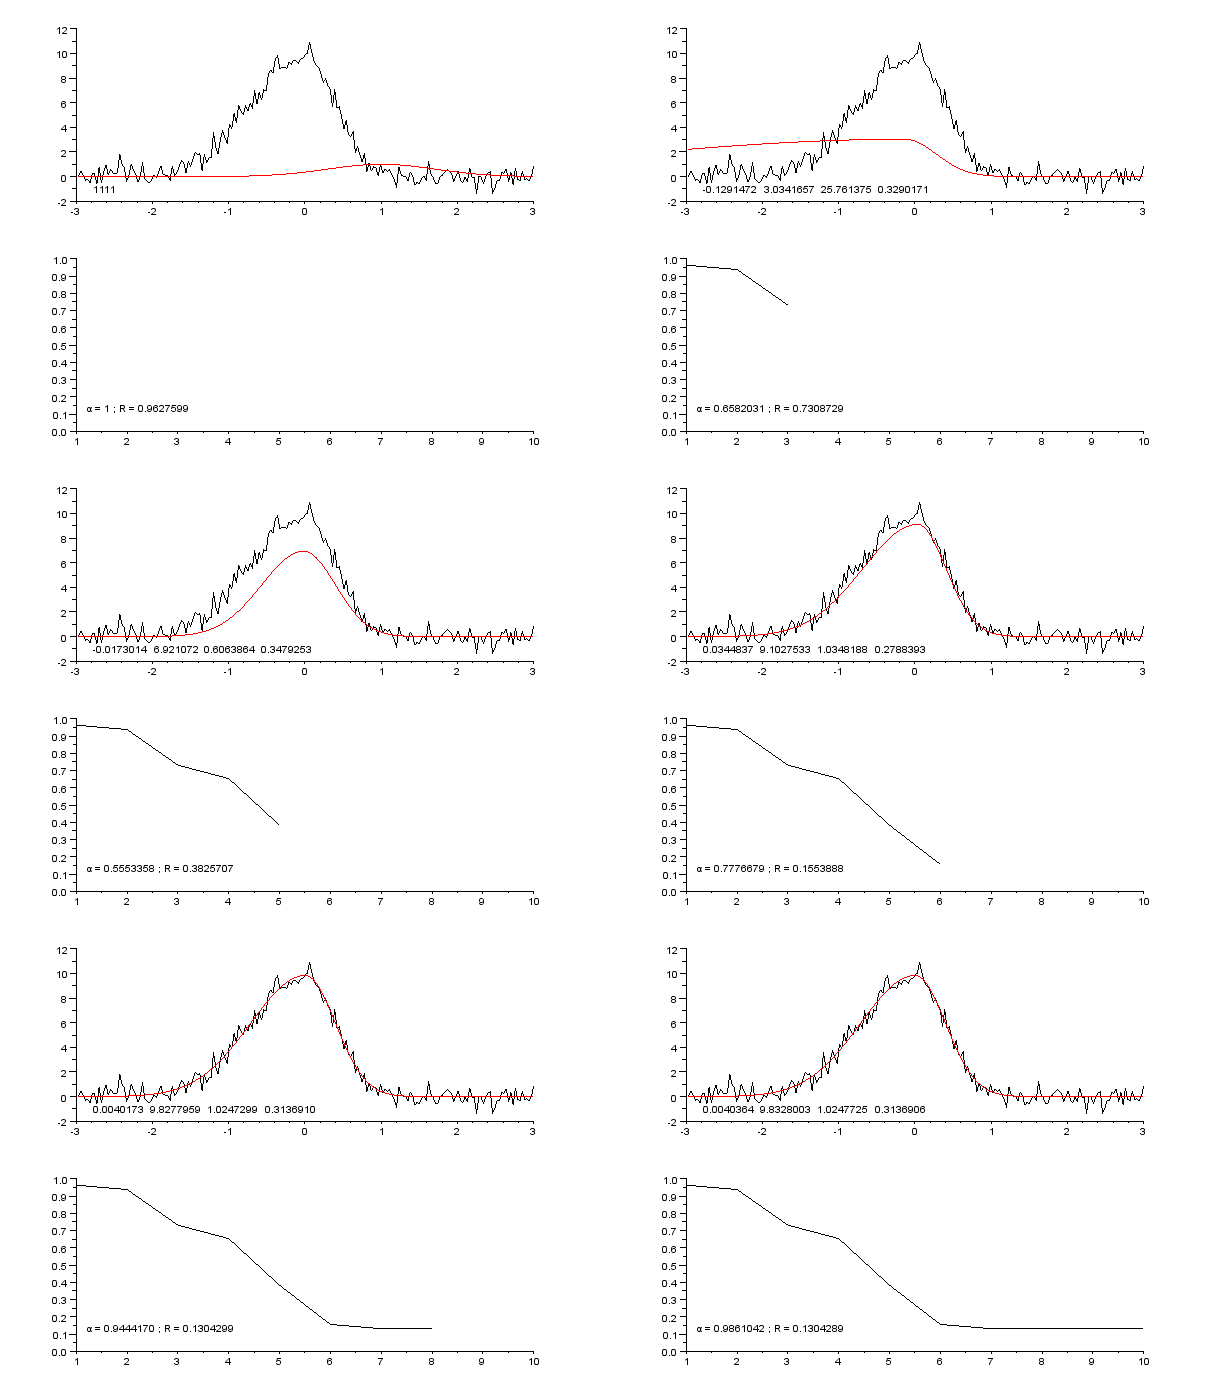
English: Successive steps of Gauss-Newton regression, with variable damping factor α, to fit a dissymetrical noisy peak. Pictures created with Scilab, animated with The Gimp.
Français : Étapes successives d'une régression de Gauss-Newton, avec facteur d'amortissement α variable, pour ajuster un pic assymétrique. Images créées avec Scilab ; animation créée avec The Gimp.
Date
Source Own work
Author Cdang (Christophe Dang Ngoc Chan)

Scilab source

Le fichier de données et celui de fonctions communes sont identiques à ceux de File:Regression pic gaussien dissymetrique bruite.svg.

// **********
// Constantes et initialisation
// **********

clear;
clf;

chdir('monchemin/')

// Paramètres de Newton-Raphson
precision = 1e-7; // condition d'arrêt
itermax = 60; // idem
 
// Précision de la linéarisation approchée
epsilon = 1e-6;
 
// **********
// Fonctions
// **********
 
exec('fonctions_communes.sce', -1)
 
function [e] = res(Yexp, Ycal)
    e = sqrt(sum((Yexp-Ycal).^2));
endfunction
 
function [A, R] = gaussnewton(f, X, Yexp, A0, imax, epsilon)
    // A : jeu de paramètres optimisé par régression (vecteur)
    // R : liste des facteurs de qualité de la régression
    // pour chaque étape (vecteur)
    // X : variable explicative (vecteur)
    // Yexp : variable expliquée, valeurs mesurées (vecteur)
    // A0 : paramètres d'initialisation du modèle (vecteur)
    // epsilon : valeur d'arrêt (scalaire)
    k = 1; // facteur d'amortissement initial, <=1,
    // évite la divergence 
    n = size(X,'*');
    e0 = sqrt(sum(Yexp.^2)); // normalisation du facteur de qualité
    Ycal = f(A0, X); // modèle initial
    R(1) = res(Yexp, Ycal)/e0; // facteur de qualité initial
    disp('i = 1 ; k = 1 ; R = '+string(R(1))) // affichage param initiaux
    i = 1;
    B = A0;
        subplot(2,1,1)
        plot2d(X, Yexp, rect=[-3, -2, 3, 12])
        plot(X, Ycal, "-r")
        xstring(-2.8, -1.5, string(B))
        subplot(2,1,2)
        plot2d(R, rect=[1, 0, 10, 1])
        xstring(1.2, 0.1, 'α = '+string(k)+' ; R = '+string(R(i)))
        nom = 'picassym'+string(i)+'.gif';
        xs2gif(0,nom)
    drapeau = %t;
    while (i < imax) & drapeau // teste la convergence globale
        i = i+1;
        deltay = Yexp - Ycal;
        J = linearisation_approchee(f, B, X, epsilon); // matrice jacobienne
        tJ = J'; // transposée
        deltap0 = inv((tJ*J))*tJ*deltay;
        drapeau2 = %t // pour une 1re exécution
        while drapeau2 & (k>0.1) // teste la divergence sur 1 étape
            deltap = k*deltap0;
            Bnouveau = B + deltap';
            Ycal = f(Bnouveau, X);
            R(i) = res(Yexp, Ycal)/e0;
            drapeau2 = (R(i) >= R(i-1)) // vrai si diverge
            if drapeau2 then k = k*0.75; // atténue si diverge
            else k0 = k; // pour affichage de la valeur
                k = (1 + k)/2; // réduit l'atténuation si converge
            end
        end
        B = Bnouveau;
        drapeau = abs(R(i-1) - R(i)) > epsilon
        clf;
        subplot(2,1,1)
        plot2d(X, Yexp, rect=[-3, -2, 3, 12])
        plot(X, Ycal, "-r")
        xstring(-2.8, -1.5, string(B))
        subplot(2,1,2)
        plot2d(R, rect=[1, 0, 10, 1])
        xstring(1.2, 0.1, 'α = '+string(k0)+' ; R = '+string(R(i)))
        nom = 'picassym'+string(i)+'.gif';
        xs2gif(0,nom)
//        disp('i = '+string(i)+' ; k = '+string(k0)+' ; R = '+string(R(i)))
    end
    A = B;
endfunction
 
// **********
// Programme principal
// **********
 
// lecture des données
donnees = read('pic_gauss_dissym_bruite.txt',-1,2);
 
// carcatéristiques des données
Xdef = donnees(:,1);
Ydef = donnees(:,2);
// Ainit = [-0.03, 9.7, 8*((0.84 - 0.03)/2.35)^2, 8*((0.45 + 0.03)/2.35)^2];
Ainit = [1, 1, 1, 1];

// Régression
tic();
[Aopt, Rnr] =...
    gaussnewton(gauss_dissym, Xdef, Ydef,...
    Ainit, itermax, precision)
t = toc();

// Courbe calculée
 
Yopt = gauss_dissym(Aopt, Xdef);
 
// Affichage
 
print(%io(2),Ainit)
print(%io(2),Aopt)
print(%io(2),t)
 
clf
 
subplot(2,1,1)
plot(Xdef, Ydef, "-b")
plot(Xdef, Yopt, "-r")
 
subplot(2,1,2)
plot(Rnr)

Licensing

I, the copyright holder of this work, hereby publish it under the following licenses:
GNU head Permission is granted to copy, distribute and/or modify this document under the terms of the GNU Free Documentation License, Version 1.2 or any later version published by the Free Software Foundation; with no Invariant Sections, no Front-Cover Texts, and no Back-Cover Texts. A copy of the license is included in the section entitled GNU Free Documentation License.
w:en:Creative Commons
attribution share alike
This file is licensed under the Creative Commons Attribution-Share Alike 3.0 Unported, 2.5 Generic, 2.0 Generic and 1.0 Generic license.
You are free:
  • to share – to copy, distribute and transmit the work
  • to remix – to adapt the work
Under the following conditions:
  • attribution – You must give appropriate credit, provide a link to the license, and indicate if changes were made. You may do so in any reasonable manner, but not in any way that suggests the licensor endorses you or your use.
  • share alike – If you remix, transform, or build upon the material, you must distribute your contributions under the same or compatible license as the original.
You may select the license of your choice.

Captions

Add a one-line explanation of what this file represents

Items portrayed in this file

depicts

5 December 2012

image/gif

File history

Click on a date/time to view the file as it appeared at that time.

Date/TimeThumbnailDimensionsUserComment
current13:13, 5 December 2012Thumbnail for version as of 13:13, 5 December 2012610 × 460 (22 KB)Cdang{{Information |Description ={{en|1=alpha (damping factor) value corrected}} |Source ={{own}} |Author =Cdang |Date = |Permission = |other_versions = }}
13:09, 5 December 2012Thumbnail for version as of 13:09, 5 December 2012610 × 460 (22 KB)Cdang{{Information |Description ={{en|1=Successive steps of Gauss-Newton regression, with variable damping factor α, to fit a dissymetrical noisy peak. Pictures created with Scilab, animated with The Gimp.}} {{fr|1=Étapes successives d'une régression...

The following page uses this file:

Global file usage

The following other wikis use this file:

Metadata