File:Student t cdf.svg

Size of this PNG preview of this SVG file: 360 × 288 pixels. Other resolutions: 300 × 240 pixels | 600 × 480 pixels | 960 × 768 pixels | 1,280 × 1,024 pixels | 2,560 × 2,048 pixels.
Original file (SVG file, nominally 360 × 288 pixels, file size: 35 KB)
| This is a file from the Wikimedia Commons. Information from its description page there is shown below. Commons is a freely licensed media file repository. You can help. |
Summary
| Description |
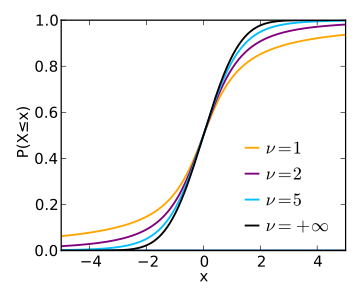
English: Plot of the cumulative distribution functions of several members of the Student t-family of probability distributions. |
| Date | |
| Source | Own work |
| Author | Skbkekas |
| SVG development | This plot was created with Matplotlib. |
| Source code | Python codeimport numpy as np
import matplotlib.pyplot as plt
import scipy.special as sp
import scipy.integrate as integral
col = ['orange', 'purple', 'deepskyblue']
X = np.arange(-5, 5, 0.005)
plt.clf()
plt.figure(figsize=(4,3.2))
plt.axes([0.17,0.13,0.79,0.8])
plt.hold(True)
A = []
def PDF(x,nu):
Y = -(nu+1)*np.log(1+x**2/nu)/2
Y += sp.gammaln((nu+1)/2.0)
Y -= sp.gammaln(nu/2.0)
Y -= 0.5*np.log(nu*np.pi)
Y = np.exp(Y)
return Y
for k,nu in enumerate([1,2,5]):
Y=[]
for x in X:
Y.append(integral.quad(lambda t: PDF(t,nu),-1000,x))
a = plt.plot(X, Y, '-', color=col[k], lw=1.5)
A.append(a)
# Degenerate into Normal distribution
from scipy.stats import norm
Y = norm.cdf(X)
a = plt.plot(X, Y, '-', color='black', lw=1.5)
A.append(a)
plt.xlabel("x")
plt.ylabel(u"P(X\N{Less-THAN OR EQUAL TO}x)")
bx = plt.legend(A, (r"$\nu=1$", r"$\nu=2$", r"$\nu=5$", r"$\nu=+\infty$"),\
numpoints=1, handlelen=0.05, handletextpad=0.4,\
loc="lower right")
bx.draw_frame(False)
plt.xlim(-5,5)
plt.savefig("student_t_cdf.pdf")
plt.savefig("student_t_cdf.eps")
plt.savefig("student_t_cdf.svg")
|
Licensing
I, the copyright holder of this work, hereby publish it under the following license:
This file is licensed under the Creative Commons Attribution 3.0 Unported license.
- You are free:
- to share – to copy, distribute and transmit the work
- to remix – to adapt the work
- Under the following conditions:
- attribution – You must give appropriate credit, provide a link to the license, and indicate if changes were made. You may do so in any reasonable manner, but not in any way that suggests the licensor endorses you or your use.
File history
Click on a date/time to view the file as it appeared at that time.
| Date/Time | Thumbnail | Dimensions | User | Comment | |
|---|---|---|---|---|---|
| current | 23:37, 3 April 2014 | | 360 × 288 (35 KB) | Hydrox | fixed colours (hand-edited SVG) |
| 07:58, 21 July 2013 |  | 360 × 288 (35 KB) | IkamusumeFan | Adjust the axis for better display. | |
| 07:51, 21 July 2013 |  | 360 × 288 (35 KB) | IkamusumeFan | 1. Using \nu instead of df, which appears in Scipy's documentation; 2. Since for some operating systems and Python versions, Scipy's stdtr function has visible errors around t=+1 and -1, we adjust the computation of CDF according to the integral defini... | |
| 15:42, 4 March 2010 |  | 360 × 288 (28 KB) | Skbkekas | Changed df's to give better spacing, used thinner lines. | |
| 04:11, 23 February 2010 |  | 360 × 288 (27 KB) | Skbkekas | {{Information |Description={{en|1=Plot of the cumulative distribution functions of several members of the Student t-family of probability distributions.}} |Source={{own}} |Author=Skbkekas |Date=2010-02-22 |Permission= |other_versions= }} |
File usage
The following page uses this file:
Global file usage
The following other wikis use this file:
- Usage on be.wikipedia.org
- Usage on ca.wikipedia.org
- Usage on en.wikipedia.org
- Usage on en.wikibooks.org
- Usage on fi.wikipedia.org
- Usage on it.wikipedia.org
- Usage on ja.wikipedia.org
- Usage on jv.wikipedia.org
- Usage on ko.wikipedia.org
- Usage on sq.wikipedia.org
- Usage on sr.wikipedia.org
- Usage on tl.wikipedia.org