2022 United States House of Representatives elections
House elections for the 118th U.S. Congress
The 2022 United States House of Representatives elections were held on November 8 2022 to elect the United States House of Representatives. It was part of the 2022 United States elections.
| ||||||||||||||||||||||||||||||||||
All 435 seats in the United States House of Representatives[a] 218 seats needed for a majority | ||||||||||||||||||||||||||||||||||
|---|---|---|---|---|---|---|---|---|---|---|---|---|---|---|---|---|---|---|---|---|---|---|---|---|---|---|---|---|---|---|---|---|---|---|
| ||||||||||||||||||||||||||||||||||
 Results Democratic gain Republican gain Democratic hold Republican hold | ||||||||||||||||||||||||||||||||||
| ||||||||||||||||||||||||||||||||||
.jpg)

The Republican Party gained control of the House from the Democratic Party. Republican Kevin McCarthy replaced Democratic Nancy Pelosi as Speaker.
Results
changeFederal
change| 222 | 213 |
| Republican | Democratic |
| Parties | Popular vote | Seats | |||||||
|---|---|---|---|---|---|---|---|---|---|
| Vote | % | Change | 2020 | 2022 | +/− | Strength | +/− | ||
| Republican Party | 54,227,992 | 50.0% | +2.8% | 213 | 222 | 51.0% | +2.0% | ||
| Democratic Party | 51,280,463 | 47.3% | –3.0% | 222 | 213 | 49.0% | –2.0% | ||
| Libertarian Party | 724,264 | 0.7% | – | — | — | — | — | — | |
| Independent | 515,322 | 0.5% | +0.2% | — | — | — | — | — | |
| Green Party | 69,802 | 0.1% | — | — | — | — | — | — | |
| Constitution Party | 29,886 | 0.0% | –0.1% | — | — | — | — | — | |
| Other parties | 1,481,822 | 1.4% | +0.1% | — | — | — | — | — | |
| Write-ins | 113,836 | 0.1% | – | — | — | — | — | — | |
| Totals | 108,443,387 | 100.0% | — | 435 | 435 | 100.0% | — | ||
| Source: [1] Election Statistics – Office of the Clerk | |||||||||
By state
change| State | Total seats |
Republican | Democratic | ||
|---|---|---|---|---|---|
| Seats | Change | Seats | Change | ||
| Alabama | 7 | 6 | 1 | ||
| Alaska | 1 | 0 | 1 | ||
| Arizona | 9 | 6 | 3 | ||
| Arkansas | 4 | 4 | 0 | ||
| California | 52 | 12 | 40 | ||
| Colorado | 8 | 3 | 5 | ||
| Connecticut | 5 | 0 | 5 | ||
| Delaware | 1 | 0 | 1 | ||
| Florida | 28 | 20 | 8 | ||
| Georgia | 14 | 9 | 5 | ||
| Hawaii | 2 | 0 | 2 | ||
| Idaho | 2 | 2 | 0 | ||
| Illinois | 17 | 3 | 14 | ||
| Indiana | 9 | 7 | 2 | ||
| Iowa | 4 | 4 | 0 | ||
| Kansas | 4 | 3 | 1 | ||
| Kentucky | 6 | 5 | 1 | ||
| Louisiana | 6 | 5 | 1 | ||
| Maine | 2 | 0 | 2 | ||
| Maryland | 8 | 1 | 7 | ||
| Massachusetts | 9 | 0 | 9 | ||
| Michigan | 13 | 6 | 7 | ||
| Minnesota | 8 | 4 | 4 | ||
| Mississippi | 4 | 3 | 1 | ||
| Missouri | 8 | 6 | 2 | ||
| Montana | 2 | 2 | 0 | ||
| Nebraska | 3 | 3 | 0 | ||
| Nevada | 4 | 1 | 3 | ||
| New Hampshire | 2 | 0 | 2 | ||
| New Jersey | 12 | 3 | 9 | ||
| New Mexico | 3 | 0 | 3 | ||
| New York | 26 | 11 | 15 | ||
| North Carolina | 14 | 7 | 7 | ||
| North Dakota | 1 | 1 | 0 | ||
| Ohio | 15 | 10 | 5 | ||
| Oklahoma | 5 | 5 | 0 | ||
| Oregon | 6 | 2 | 4 | ||
| Pennsylvania | 17 | 8 | 9 | ||
| Rhode Island | 2 | 0 | 2 | ||
| South Carolina | 7 | 6 | 1 | ||
| South Dakota | 1 | 1 | 0 | ||
| Tennessee | 9 | 8 | 1 | ||
| Texas | 38 | 25 | 13 | ||
| Utah | 4 | 4 | 0 | ||
| Vermont | 1 | 0 | 1 | ||
| Virginia | 11 | 5 | 6 | ||
| Washington | 10 | 2 | 8 | ||
| West Virginia | 2 | 2 | 0 | ||
| Wisconsin | 8 | 6 | 2 | ||
| Wyoming | 1 | 1 | 0 | ||
| Total | 435 | 222 | 213 | ||
Maps
change-
 House seats by party holding majority in state
 -
 Popular vote by states
 -
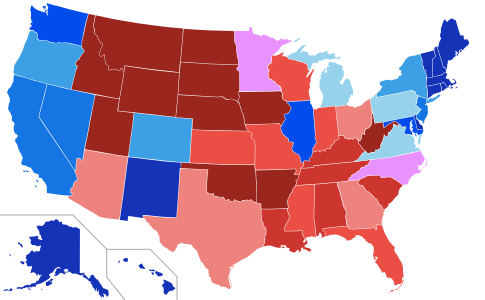
 Net changes to U.S. House seats after the 2022 elections
+1 Dem House seat +2 Dem House seats
+1 Rep House seat +2 Rep House seats
+3–4 Rep House seats
Republicans lost 1 seat due to reapportionment -
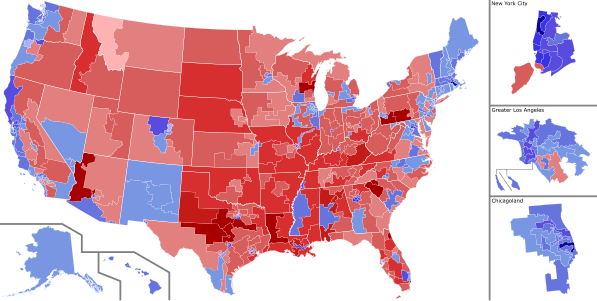 District results by vote share


Notes
change- ↑ Also included are five non-voting delegates.