False color

methods of visualizing information by translating to colors

False color (or false colour) refers to a group of color methods used to display recorded images in color. A false-color image is an image which shows an object in colors different from that which a true-colour photograph would show.

False-color image of Las Vegas. Grassland, and vegetation appears in red.

In addition, there is false color used for visualization of genuine data.

A photograph shot in color will show the colors in the picture as they appeared on the film, or to the sensor of a digital camera. Since most films and most digital cameras are made to show the world as human color vision would see it, this is known as true-color image. In a false color image, the color shown in the image does not correspond to the one the human eye would see. In such an image, color is used for extra information that the eye would not see. Many false color images, for example, show infrared light that humans cannot see.

Examples where color is used to give more information
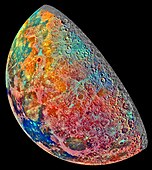
This image shows compositional variations of the Moon overlaid as pseudocolor. Bright pinkish areas are highlands materials, blue to orange shades indicate volcanic lava flows. Recent impacted soils are represented by light blue colors; the youngest craters have prominent blue rays extending from them.
This image shows compositional variations of the Moon overlaid as pseudo color.
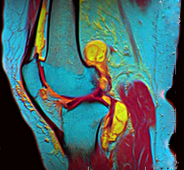
A grayscale MRI of a knee – different gray levels indicate different tissue types, requiring a trained eye.
A pseudocolor MRI of a knee created using three different grayscale scans – tissue types are easier to discern through pseudo color.
Two Landsat satellite images showing the same region:
Chesapeake Bay and the city of Baltimore[1]
This true-color image shows the area in actual colors, e.g., the vegetation appears in green. It covers the full visible spectrum using the red, green and blue / green spectral bands of the satellite mapped to the RGB color space of the image.
The same area as a false-color image using the near infrared, red and green spectral bands mapped to RGB – this image shows vegetation in a red tone, as vegetation reflects most light in the near infrared.

References

change
  1. "The Landsat 7 Compositor". landsat.gsfc.nasa.gov. 2011-03-21. Archived from the original on 2013-09-21. Retrieved 2012-09-01.