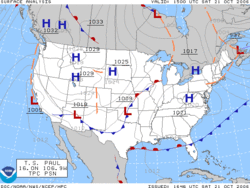
Weather map
A weather map is a tool. It shows facts about the weather quickly.[1] Weather maps have been used from the mid-19th century, for study and for weather forecasting. Some maps show differences of temperature, and weather fronts.


A station model is a symbolic picture showing the weather at a reporting station. Meteorologists made the station model to put down many weather elements in a small space on weather maps. Maps thickly filled with station-model plots can be hard to read. However, they help meteorologists, pilots, and mariners to see important weather patterns. A computer draws a station model for every place of observation. The station model is mostly used for surface-weather maps. It can also be used to show the weather in the sky, though. A complete station-model map lets people study patterns in air pressure, temperature, wind, cloud cover, and precipitation.[2]
History
changePeople first began using weather charts in a modern way in the mid-19th century. They began using them to make a theory about storm systems.[3] When a telegraph network developed by 1845, it was possible for people to collect information about the weather. They could get the information from many different places far away quickly enough for the information to be useful. In the 1840s, Joseph Henry took charge.[4] He helped the Smithsonian Institution focus most of its observers on the center and the eastern part of the United States during the 1840s and 1860s.[4] The U.S. Army Signal Corps kept up this network between 1870 and 1874 by an act of Congress. It later expanded to the Western United States.
At first, all the data on the map was not taken from these analyses. This was because there was not enough time standardization. People first tried to standardize time in Great Britain in 1855. The entire United States was not influenced by time zones (areas with different times) until 1906.[5] This was when Detroit had made the standard time at last.[5] Over all the earth, other countries began taking weather observations at the same time. This started in 1873.[6]
References
change- ↑ Encarta (2009). "Chart". Microsoft Corporation. Archived from the original on 2011-05-25. Retrieved 2007-11-25.
- ↑ CoCoRAHS (2005). Introduction to Drawing Isopleths. Archived 2007-04-28 at the Wayback Machine Colorado Climate Center. Retrieved on 2007-04-29.
- ↑ Human Intelligence (2007-07-25). "Francis Galton (1822-1911)". Indiana University. Archived from the original on 2018-10-15. Retrieved 2007-04-18.
- ↑ 4.0 4.1 John D. Cox (2002). Stormwatchers: The Turbulent History of Weather Prediction From Franklin's Kite to El Nino. John Wiley & Sons, Inc. pp. 53–56. ISBN 047138108X.
- ↑ 5.0 5.1 WebExhibits (2008). "Daylight Saving Time". Idea. Archived from the original on 2005-09-15. Retrieved 2007-06-24.
- ↑ National Oceanic and Atmospheric Administration (2007-05-30). "An Expanding Presence". United States Department of Commerce. Retrieved 2010-01-31.