Kentucky's 2nd congressional district
U.S. House district for Kentucky
Kentucky's 2nd congressional district is a congressional district in the U.S. state of Kentucky. The district is in the middle part of the state. The cities in the district are Bowling Green, Owensboro, and Elizabethtown. The people who live in the district elect a person to represent the district in the United States House of Representatives. The district is currently represented by Republican Brett Guthrie. In the district no incumbent representative has lost an election since 1884.
| Kentucky's 2nd congressional district | |||
|---|---|---|---|
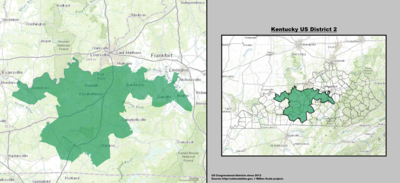 Kentucky's 2nd congressional district - since January 3, 2013. | |||
| Representative |
| ||
| Distribution |
| ||
| Population (2019) | 774,897[2] | ||
| Median household income | $53,496[3] | ||
| Ethnicity |
| ||
| Cook PVI | R+19[4] | ||
Election history
change2002
change| Party | Candidate | Votes | % | |
|---|---|---|---|---|
| Republican | Ron Lewis (Incumbent) | 122,773 | 69.64% | |
| Democratic | David Lynn Williams | 51,431 | 29.17% | |
| Libertarian | Robert Guy Dyer | 2,084 | 1.18% | |
| Total votes | 176,288 | 100.00% | ||
| Turnout | ||||
| Republican hold | ||||
2004
change| Party | Candidate | Votes | % | |
|---|---|---|---|---|
| Republican | Ron Lewis (Incumbent) | 185,394 | 67.92% | |
| Democratic | Adam Smith | 87,585 | 32.08% | |
| Total votes | 272,979 | 100.00% | ||
| Turnout | ||||
| Republican hold | ||||
2006
change| Party | Candidate | Votes | % | |
|---|---|---|---|---|
| Republican | Ron Lewis (Incumbent) | 118,548 | 55.41% | |
| Democratic | Mike Weaver | 95,415 | 44.59% | |
| Total votes | 213,963 | 100.00% | ||
| Turnout | ||||
| Republican hold | ||||
2008
change| Party | Candidate | Votes | % | |
|---|---|---|---|---|
| Republican | Brett Guthrie | 158,936 | 52.57% | |
| Democratic | David E. Boswell | 143,379 | 47.43% | |
| Total votes | 302,315 | 100.00% | ||
| Turnout | ||||
| Republican hold | ||||
2010
change| Party | Candidate | Votes | % | |
|---|---|---|---|---|
| Republican | Brett Guthrie (Incumbent) | 155,906 | 67.89% | |
| Democratic | Ed Marksberry | 73,749 | 28.75% | |
| Total votes | 229,655 | 100.00% | ||
| Turnout | ||||
| Republican hold | ||||
2012
change| Party | Candidate | Votes | % | |
|---|---|---|---|---|
| Republican | Brett Guthrie (Incumbent) | 181,508 | 64.30% | |
| Democratic | David Lynn Williams | 89,541 | 31.72% | |
| Independent | Andrew R. Beacham | 6,304 | 2.23% | |
| Libertarian | Craig Astor | 4,914 | 1.74% | |
| Total votes | 282,267 | 100.00% | ||
| Turnout | ||||
| Republican hold | ||||
2014
change| Party | Candidate | Votes | % | |
|---|---|---|---|---|
| Republican | Brett Guthrie (Incumbent) | 156,936 | 69.19% | |
| Democratic | Ron Leach | 69,898 | 30.81% | |
| Total votes | 226,834 | 100.00% | ||
| Turnout | ||||
| Republican hold | ||||
2016
change| Party | Candidate | Votes | % | |
|---|---|---|---|---|
| Republican | Brett Guthrie (Incumbent) | 251,823 | 100.00% | |
| Total votes | 251,823 | 100.00% | ||
| Turnout | ||||
| Republican hold | ||||
2018
change| Party | Candidate | Votes | % | |
|---|---|---|---|---|
| Republican | Brett Guthrie (Incumbent) | 171,700 | 66.7% | |
| Democratic | Hank Linderman | 79,964 | 31.1% | |
| Independent | Thomas Loecken | 5,681 | 2.2% | |
| Total votes | 257,345 | 100.0% | ||
| Republican hold | ||||
2020
change| Party | Candidate | Votes | % | |
|---|---|---|---|---|
| Republican | Brett Guthrie (incumbent) | 255,735 | 70.9 | |
| Democratic | Hank Linderman | 94,643 | 26.3 | |
| Libertarian | Robert Lee Perry | 7,588 | 2.1 | |
| Populist | Lewis Carter | 2,431 | 0.7 | |
| Write-in | 2 | 0.0 | ||
| Total votes | 360,399 | 100.0 | ||
| Republican hold | ||||
References
change- ↑ Geography, US Census Bureau. "Congressional Districts Relationship Files (state-based)". www.census.gov. Archived from the original on 2017-07-17. Retrieved 2018-02-11.
- ↑ Bureau, Center for New Media & Promotion (CNMP), US Census. "My Congressional District". www.census.gov.
{{cite web}}:|last=has generic name (help)CS1 maint: multiple names: authors list (link) - ↑ Center for New Media & Promotion (CNMP), US Census Bureau. "My Congressional District". www.census.gov.
- ↑ "Partisan Voting Index – Districts of the 115th Congress" (PDF). The Cook Political Report. April 7, 2017. Archived from the original (PDF) on June 7, 2017. Retrieved April 7, 2017.