Limón Province
Limón is a province of Costa Rica. It is in the eastern part of the country along the Caribbean Sea. The provincial capital is the city of Puerto Limón.
Limón Province
Provincia de Limón | |
|---|---|
 Beach in Tortuguero National Park, Limón | |
 Flag  Coat of arms | |
 Location of the Province of Limón | |
| Coordinates: 10°02′N 83°13′W / 10.03°N 83.22°W | |
| Country | Costa Rica |
| Province since | 1902 |
| Capital city | Puerto Limón |
| Area | |
| • Total | 9,188.52 km2 (3,547.71 sq mi) |
| Population (2011)[2] | |
| • Total | 386,862 |
| • Density | 42/km2 (110/sq mi) |
| Demonym | Limonense |
| ISO 3166 code | CR-L |
Location
changeThe Limón province borders the provinces of Heredia, Cartago and San José to the west, and Puntarenas province to the southwest. Nicaragua is to the north of the province, Panama to the south and the Caribbean Sea to the east.
Geography
changeLimón is the fourth largest province of Costa Rica, after the Puntarenas, Guanacaste and Alajuela provinces, with an area of 9,188.52 km2 (3,547.71 sq mi).[1] It has 18% of the area of Costa Rica.
Most of territory of the province is flat land of low altitude but in the southwest is the Cordillera de Talamanca ("Talamaca mountain range") with the highest mountain of the country, the Cerro Chirripó, with an altitude of 3,819 m (12,530 ft) above sea level.[1]
The main river of the province is the Reventazón, the second longest river of the country after the Térraba; it is 145 m (476 ft) long.
Weather
changeUnlike the rest of Costa Rica, Limón has no dry-wet seasons. It rains all the year. The driest months are in September and October. The Köppen climate classification type for the climate at Puerto Limón is a "Tropical Rainforest Climate" and of the subtype "Af".[3]
The average amount of precipitation for the year in Puerto Limón is 3,398.5 mm (133.8 in). The month with the most precipitation on average is July with 411.5 mm (16.2 in) of precipitation. The month with the least precipitation on average is September with an average of 142.2 mm (5.6 in).
The average temperature for the year in Puerto Limón is 26.1 °C (79.0 °F). The warmest month, on average, is May with an average temperature of 27.2 °C (81.0 °F). The coolest month on average is January, with an average temperature of 25 °C (77 °F)
| Climate data for Puerto Limón, France | |||||||||||||
|---|---|---|---|---|---|---|---|---|---|---|---|---|---|
| Month | Jan | Feb | Mar | Apr | May | Jun | Jul | Aug | Sep | Oct | Nov | Dec | Year |
| Average high °C (°F) | 28 (82) |
28 (82) |
28 (82) |
29 (84) |
29 (84) |
29 (84) |
28 (82) |
28 (82) |
30 (86) |
29 (84) |
28 (82) |
28 (82) |
29 (83) |
| Daily mean °C (°F) | 25 (77) |
25 (77) |
26 (79) |
26 (79) |
27 (81) |
26 (79) |
26 (79) |
26 (79) |
26 (79) |
26 (79) |
26 (79) |
25 (77) |
26 (79) |
| Average low °C (°F) | 22 (72) |
22 (72) |
22 (72) |
23 (73) |
23 (73) |
23 (73) |
23 (73) |
23 (73) |
23 (73) |
23 (73) |
23 (73) |
22 (72) |
23 (73) |
| Average rainfall mm (inches) | 310 (12.2) |
210 (8.3) |
200 (7.9) |
270 (10.6) |
280 (11.0) |
280 (11.0) |
410 (16.1) |
290 (11.4) |
140 (5.5) |
180 (7.1) |
370 (14.6) |
400 (15.7) |
3,340 (131.4) |
| Source: Weatherbase.com [1] | |||||||||||||
Demographics
changeThe people of the province are known as Limonenses, both men and women.
The Limón province had a population, in 2011, of 386,862, 9% of the population of the country. Its population density was 42.1 inhabitants/km2. The canton of Pococí, with 125,962 inhabitants, is the canton with more inhabitants.[2]
Evolution of the population in Limón[2]

Administrative divisions
changeThe Limón province is divided in 6 cantons, which are divided into 29 Districts.[4]
| No. | Canton | Capital | Districts | Population[5] (2011) |
Area (km²) |
Density (Inh./km²) |
|---|---|---|---|---|---|---|
| 1 | Limón | Puerto Limón | 4 | 94,415 | 1,765.79 | 53.5 |
| 2 | Pococí | Guápiles | 7 | 125,962 | 2,403.49 | 52.4 |
| 3 | Siquirres | Siquirres | 6 | 56,786 | 860.19 | 66.0 |
| 4 | Talamanca | Bribri | 4 | 30,712 | 2,809.93 | 10.9 |
| 5 | Matina | Matina | 3 | 37,721 | 772.64 | 48.8 |
| 6 | Guácimo | Guácimo | 5 | 41,266 | 576.48 | 71.6 |
Economy
changeThe main economic activity in the province is farming, with plantations of banana, pineapple, cacao, pejibaye and other tropical crops.
In the province is the port of Moín, the most important in the country.
Gallery
change-
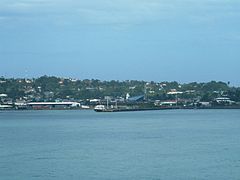 Puerto Limón
 -
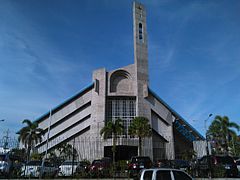 Cathedral of Limón
 -
 The Cerro Chirripó


References
change- ↑ 1.0 1.1 1.2 "Anuario Estadístico 2012 - 2013" (PDF) (in Spanish). San José, Costa Rica: Instituto Nacional de Estadística y Censos (INEC). June 2015. Archived from the original (PDF) on 14 November 2016. Retrieved 16 December 2016.
- ↑ 2.0 2.1 2.2 "Anuario Estadístico 2012 - 2013" (PDF) (in Spanish). San José, Costa Rica: Instituto Nacional de Estadística y Censos (INEC). June 2015. p. 101. Archived from the original (PDF) on 14 November 2016. Retrieved 16 December 2016.
- ↑ "Puerto Limón, Costa Rica - Köppen Climate Classification". Weatherbase. Retrieved 16 December 2016.
- ↑ "Anuario Estadístico 2012 - 2013" (PDF) (in Spanish). San José, Costa Rica: Instituto Nacional de Estadística y Censos (INEC). June 2015. p. 50. Archived from the original (PDF) on 14 November 2016. Retrieved 16 December 2016.
- ↑ "Resultados Generales Censo 2011" (PDF). CIPAC - Centro de investigación y Promoción para America Central de Derechos Humanos (in Spanish). May 2012. pp. 48–49. Retrieved 16 December 2016.