1997 United Kingdom general election
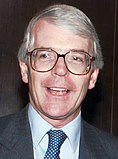
The UK general election, 1997 was an election held on 1 May 1997 to elect 659 members to the House of Commons of the United Kingdom. The three main candidates to become Prime Minister are shown to the right:
| |||||||||||||||||||||||||||||||||||||||||||||
All 659 seats to the House of Commons 330 seats needed for a majority | |||||||||||||||||||||||||||||||||||||||||||||
|---|---|---|---|---|---|---|---|---|---|---|---|---|---|---|---|---|---|---|---|---|---|---|---|---|---|---|---|---|---|---|---|---|---|---|---|---|---|---|---|---|---|---|---|---|---|
| Opinion polls | |||||||||||||||||||||||||||||||||||||||||||||
| Turnout | 71.3% ( | ||||||||||||||||||||||||||||||||||||||||||||
| |||||||||||||||||||||||||||||||||||||||||||||
 Colours show the winning party, as shown in the main table of results. * Indicates boundary change, so this is a nominal figure. † Notional 1992 results on new boundaries. ^ Figure does not include the speaker. | |||||||||||||||||||||||||||||||||||||||||||||
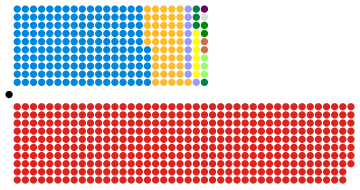
 Composition of the House of Commons after the election | |||||||||||||||||||||||||||||||||||||||||||||
| |||||||||||||||||||||||||||||||||||||||||||||
The Labour Party and its leader Tony Blair gained the majority of seats and created the first Labour government since 1979. The Labour Party won 418 seats which was the highest majority of seats for any party since the Conservatives in the 1931 General Election. The Conservative Party suffered it's lowest number of seats since 1906 and lost all of its seats in Scotland and Wales. Several prominent Conservative politicians lost their seats such as Defence Secretary Michael Portillo, Foreign Secretary Malcolm Rifkind, Scottish Secretary Michael Forsyth as well as Edwina Currie, David Mellor and Ian Lang.
The Liberal Democrats won 46 seats, which was the highest number of seats for a third party since 1929. The Referendum Party ran on the single issue of taking Britain out of the European Union and won 2.6% of the vote but no seats.
The final results of the election were:
- Labour Party (418 MP's, 43.2% of vote)
- Conservative Party (165 MP's, 30.7% of vote)
- Liberal Democrats (46 MP's, 16.8% of vote)
- Referendum Party (0 MP's, 2.6% of vote)
- Scottish National Party (6 MP's, 2.0% of vote) - Scotland only
- Ulster Unionist Party (10 MP's, 0.8% of vote) - Northern Ireland only
- Social Democratic and Labour Party (3 MP's, 0.6% of vote) - Northern Ireland only
- Plaid Cymru (4 MP's, 0.5% of vote) - Wales only
- Sinn Fein (2 MP's, 0.4% of vote) - Northern Ireland only
- Democratic Unionist Party (2 MP's, 0.3% of vote) - Northern Ireland only
- UK Independence Party (0 MP's, 0.3% of vote)
- Green Party (0 MP's, 0.3% of vote)
- Alliance Party of Northern Ireland (0 MP's, 0.2% of vote) - Northern Ireland only
- Socialist Labour Party (0 MP's, 0.2% of vote)
- Liberal Party (0 MP's, 0.1% of vote)
- British National Party (0 MP's, 0.1% of vote)
Notes
change- ↑ Conservative party leader John Major resigned as Leader of the Conservative Party on 22 June 1995 to face critics in his party and government, and was reelected as Leader on 4 July 1995. Prior to his resignation he had held the post of Leader of the Conservative Party since 28 November 1990.[1]
References
change- ↑ "1995: Major wins Conservative leadership". BBC News. 4 July 1995.


