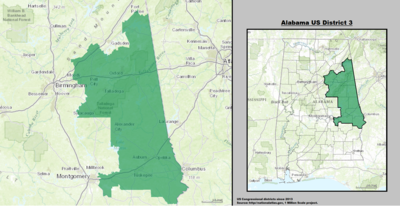
Alabama's 3rd congressional district
U.S. house district
Alabama's 3rd congressional district is a United States congressional district in the state of Alabama. The district elects a person to represent the district in the United States House of Representatives. The district has been represented by Republican Mike Rogers since 2003.
| Alabama's 3rd congressional district | |||
|---|---|---|---|
 Alabama's 3rd congressional district - since January 3, 2013. | |||
| Representative |
| ||
| Area | 7,988 sq mi (20,690 km2) | ||
| Distribution |
| ||
| Population (2019) | 717,896[2] | ||
| Median household income | $51,925[2] | ||
| Ethnicity |
| ||
| Occupation |
| ||
| Cook PVI | R+16[3] | ||
The district is in the east and middle of Alabama and is part of Montgomery and the entirety of Calhoun, Chambers, Cherokee, Clay, Cleburne, Lee, Macon, Randolph, Russell, St. Clair, Talladega, and Tallapoosa counties.
Election results from statewide races
change| Year | Office | Results |
|---|---|---|
| 2000 | President | Bush 52 - 47% |
| 2004 | President | Bush 58 - 41% |
| 2008 | President | McCain 56 - 43% |
| 2012 | President | Romney 62 - 37% |
| 2016 | President | Trump 64 - 33% |
| Party | Candidate | Votes | % | |
|---|---|---|---|---|
| Republican | Mike Rogers (Incumbent) | 98,257 | 59.44% | |
| Democratic | Greg Pierce | 63,559 | 38.45% | |
| Independent | Mark Layfield | 3,414 | 2.07% | |
| Write-in | 71 | 0.04% | ||
| Total votes | 165,301 | 100% | ||
| Republican hold | ||||
| Party | Candidate | Votes | % | |
|---|---|---|---|---|
| Republican | Mike Rogers (Incumbent) | 142,708 | 54.03% | |
| Democratic | Joshua Segall | 121,080 | 45.84% | |
| Write-in | 332 | 0.13% | ||
| Total votes | 264,120 | 100% | ||
| Republican hold | ||||
| Party | Candidate | Votes | % | |
|---|---|---|---|---|
| Republican | Mike Rogers (Incumbent) | 117,698 | 59.49% | |
| Democratic | Steve Segrest | 80,155 | 40.51% | |
| Total votes | 197,853 | 100% | ||
| Republican hold | ||||
| Party | Candidate | Votes | % | |
|---|---|---|---|---|
| Republican | Mike Rogers (Incumbent) | 174,986 | 64.12% | |
| Democratic | John Andrew Harris | 97,910 | 35.88% | |
| Total votes | 272,896 | 100% | ||
| Republican hold | ||||
| Party | Candidate | Votes | % | |
|---|---|---|---|---|
| Republican | Mike Rogers (Incumbent) | 103,558 | 66.12% | |
| Democratic | Jesse Smith | 52,816 | 33.72% | |
| Write-in | 246 | 0.16% | ||
| Total votes | 156,620 | 100% | ||
| Republican hold | ||||
| Party | Candidate | Votes | % | |
|---|---|---|---|---|
| Republican | Mike Rogers (Incumbent) | 192,164 | 66.93% | |
| Democratic | Jesse Smith | 94,549 | 32.93% | |
| Write-in | 391 | 0.14% | ||
| Total votes | 287,104 | 100% | ||
| Republican hold | ||||
| Party | Candidate | Votes | % | |
|---|---|---|---|---|
| Republican | Mike Rogers (Incumbent) | 147,770 | 63.72% | |
| Democratic | Mallory Hagan | 83,996 | 36.22% | |
| Write-in | 149 | 0.06% | ||
| Total votes | 231,915 | 100% | ||
| Republican hold | ||||
| Party | Candidate | Votes | % | |
|---|---|---|---|---|
| Republican | Mike Rogers (incumbent) | 217,384 | 67.5 | |
| Democratic | Adia Winfrey | 104,595 | 32.5 | |
| Write-in | 255 | 0.1 | ||
| Total votes | 322,234 | 100.0 | ||
| Republican hold | ||||
References
change- ↑ http://proximityone.com/cd113_2010_ur.htm
- ↑ 2.0 2.1 "My Congressional District".
- ↑ "Partisan Voting Index – Districts of the 115th Congress" (PDF). The Cook Political Report. April 7, 2017. Archived from the original (PDF) on June 7, 2017. Retrieved April 7, 2017.