Electoral district of Playford
state electoral district of South Australia
Playford is an electoral district of South Australia. It was created in 1970.
| Playford South Australia—House of Assembly | |||||||||||||||
|---|---|---|---|---|---|---|---|---|---|---|---|---|---|---|---|
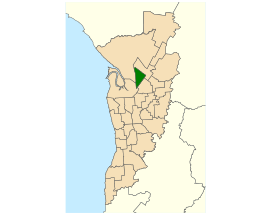
 Electoral district of Playford (green) in the Greater Adelaide area | |||||||||||||||
| State | South Australia | ||||||||||||||
| Created | 1970 | ||||||||||||||
| MP | John Fulbrook | ||||||||||||||
| Party | Labor | ||||||||||||||
| Namesake | Sir Thomas Playford IV | ||||||||||||||
| Electors | 26,374 (2018) | ||||||||||||||
| Area | 24.61 km2 (9.5 sq mi) | ||||||||||||||
| Demographic | Metropolitan | ||||||||||||||
| Coordinates | 34°49′6″S 138°38′12″E / 34.81833°S 138.63667°E | ||||||||||||||
| |||||||||||||||
| Footnotes | |||||||||||||||
| Electoral District map[1] | |||||||||||||||
Playford is in Adelaide.
Election results
change| 2022 South Australian state election: Playford | |||||
|---|---|---|---|---|---|
| Party | Candidate | Votes | % | ±% | |
| Labor | John Fulbrook | 11,922 | 53.5 | +3.1 | |
| Liberal | Hemant Dave | 5,511 | 24.7 | +6.8 | |
| Greens | David Wright | 2,118 | 9.5 | +4.6 | |
| Family First | Rojan Jose | 1,773 | 8.0 | +8.0 | |
| Independent | Shane Quinn | 973 | 4.4 | +4.4 | |
| Total formal votes | 22,297 | 95.7 | |||
| Informal votes | 1,011 | 4.3 | |||
| Turnout | 23,308 | 87.4 | |||
| Two-party-preferred result | |||||
| Labor | John Fulbrook | 14,777 | 66.3 | −2.7 | |
| Liberal | Hemant Dave | 7,520 | 33.7 | +2.7 | |
| Labor hold | Swing | −2.7 | |||
References
change- ↑ Electoral District of Playford (Map). Electoral Commission of South Australia. 2018. Retrieved 1 April 2018.[permanent dead link]