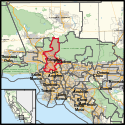
California's 30th congressional district
California's 30th congressional district is a congressional district in the U.S. state of California. It is San Fernando Valley in Los Angeles County, California. The cities in the district are: Bell Canyon, Canoga Park, Los Angeles, Chatsworth, Los Angeles, Encino, Los Angeles, Granada Hills, Los Angeles, Hidden Hills, Northridge, Los Angeles, Porter Ranch, Los Angeles, Reseda, Los Angeles, Santa Susana Field Laboratory, Sherman Oaks, Los Angeles, Studio City, Los Angeles, Tarzana, Los Angeles, Toluca Lake, Los Angeles, West Hills, Los Angeles, Winnetka, Los Angeles, and Woodland Hills, Los Angeles. The people who live in the district elect a representative in the United States House of Representatives. The district is currently represented by Democrat Brad Sherman.
| California's 30th congressional district | |||
|---|---|---|---|
Interactive map of district boundaries since January 3, 2023 | |||
| Representative |
| ||
| Population (2022) | 732,048 | ||
| Median household income | $85,046[1] | ||
| Ethnicity |
| ||
| Cook PVI | D+23[2] | ||
Election history
change1998
change| Party | Candidate | Votes | % | |
|---|---|---|---|---|
| Democratic | Xavier Becerra (Incumbent) | 58,230 | 81.2 | |
| Republican | Patricia Parker | 13,441 | 18.8 | |
| Total votes | 71,671 | 100.0 | ||
| Democratic hold | ||||
2000
change| Party | Candidate | Votes | % | |
|---|---|---|---|---|
| Democratic | Xavier Becerra (Incumbent) | 83,223 | 83.3 | |
| Republican | Tony Goss | 11,788 | 11.8 | |
| Libertarian | Jason E. Heath | 2,858 | 2.9 | |
| Natural Law | Gary D. Hearne | 2,051 | 2.0 | |
| Total votes | 99,920 | 100.0 | ||
| Democratic hold | ||||
2002
change| Party | Candidate | Votes | % | |
|---|---|---|---|---|
| Democratic | Henry Waxman (Incumbent) | 130,604 | 70.4 | |
| Republican | Tony D. Goss | 54,989 | 29.6 | |
| Total votes | 185,593 | 100.0 | ||
| Democratic hold | ||||
2004
change| Party | Candidate | Votes | % | |
|---|---|---|---|---|
| Democratic | Henry Waxman (Incumbent) | 216,682 | 71.3 | |
| Republican | Victor Elizalde | 87,465 | 28.7 | |
| Total votes | 313,147 | 100.0 | ||
| Democratic hold | ||||
2006
change| Party | Candidate | Votes | % | |
|---|---|---|---|---|
| Democratic | Henry Waxman (Incumbent) | 151,284 | 71.5 | |
| Republican | David Nelson Jones | 55,904 | 26.4 | |
| Peace and Freedom | Adele M. Cannon | 4,546 | 2.1 | |
| Total votes | 211,734 | 100.0 | ||
| Democratic hold | ||||
2008
change| Party | Candidate | Votes | % | |
|---|---|---|---|---|
| Democratic | Henry Waxman (Incumbent) | 242,792 | 100.0 | |
| Democratic hold | ||||
2010
change| Party | Candidate | Votes | % | |
|---|---|---|---|---|
| Democratic | Henry Waxman (Incumbent) | 153,663 | 64.7 | |
| Republican | Charles E. Wilkerson | 75,948 | 31.9 | |
| Libertarian | Erich D. Miller | 5,021 | 2.1 | |
| Peace and Freedom | Richard R. Castaldo | 3,115 | 1.3 | |
| Total votes | 237,747 | 100.0 | ||
| Democratic hold | ||||
2012
change| Party | Candidate | Votes | % | |
|---|---|---|---|---|
| Democratic | Brad Sherman (Incumbent) | 149,456 | 60.3 | |
| Democratic | Howard Berman (incumbent) | 98,395 | 39.7 | |
| Total votes | 247,851 | 100.0 | ||
| Democratic hold | ||||
2014
change| Party | Candidate | Votes | % | |
|---|---|---|---|---|
| Democratic | Brad Sherman (Incumbent) | 86,568 | 65.6 | |
| Republican | Mark S. Reed | 45,315 | 34.4 | |
| Total votes | 131,883 | 100% | ||
| Democratic hold | ||||
2016
change| Party | Candidate | Votes | % | |
|---|---|---|---|---|
| Democratic | Brad Sherman (Incumbent) | 205,279 | 72.6 | |
| Republican | Mark S. Reed | 77,325 | 27.4 | |
| Total votes | 282,604 | 100.0 | ||
| Democratic hold | ||||
2018
change| Party | Candidate | Votes | % | |
|---|---|---|---|---|
| Democratic | Brad Sherman (Incumbent) | 191,573 | 73.4 | |
| Republican | Mark S. Reed | 69,420 | 26.6 | |
| Total votes | 260,993 | 100.0 | ||
| Democratic hold | ||||
2020
change| Party | Candidate | Votes | % | |
|---|---|---|---|---|
| Democratic | Brad Sherman (incumbent) | 240,038 | 69.5 | |
| Republican | Mark S. Reed | 105,426 | 30.5 | |
| Total votes | 345,464 | 100.0 | ||
| Democratic hold | ||||
References
change- ↑ US Census
- ↑ "2022 Cook PVI: District Map and List". Cook Political Report. Retrieved 2023-01-10.
- ↑ 1998 election results
- ↑ 2000 election results
- ↑ 2002 election results
- ↑ 2004 election results
- ↑ 2006 election results
- ↑ 2008 election results
- ↑ 2010 election results
- ↑ 2012 election results
- ↑ 2014 election results
- ↑ 2016 election results
- ↑ 2018 election results

