Ness County, Kansas
county in Kansas, United States
Ness County (standard abbreviation: NS) is a county in the U.S. state of Kansas. In 2020, 2,687 people lived there.[1] The county seat is Ness City. Ness City is also the biggest city in Ness County.[2] The county was named after Corporal Noah V. Ness of the 7th Kansas Cavalry.[3]
Ness County | |
|---|---|
 Ness County courthouse in Ness City (2016) | |
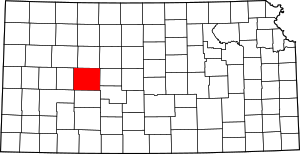
 Location within the U.S. state of Kansas | |
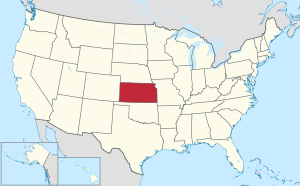
 Kansas's location within the U.S. | |
| Coordinates: 38°27′29″N 99°41′15″W / 38.4581°N 99.6875°W | |
| Country | |
| State | |
| Founded | February 26, 1867 |
| Named for | Noah V. Ness |
| Seat | Ness City |
| Largest city | Ness City |
| Area | |
| • Total | 1,075 sq mi (2,780 km2) |
| • Land | 1,075 sq mi (2,780 km2) |
| • Water | 0.3 sq mi (0.8 km2) 0.02% |
| Population | |
| • Total | 2,687 |
| • Density | 2.5/sq mi (1.0/km2) |
| Time zone | UTC−6 (Central) |
| • Summer (DST) | UTC−5 (CDT) |
| Congressional district | 1st |
| Website | nesscountyks.com |
History
change19th century
changeIn 1867, Ness County was created.
Geography
changeThe U.S. Census Bureau says that the county has a total area of 1,075 square miles (2,780 km2). Of that, 1,075 square miles (2,780 km2) is land and 0.3 square miles (0.78 km2) (0.02%) is water.[4]
People
change| Historical population | |||
|---|---|---|---|
| Census | Pop. | %± | |
| 1880 | 3,722 | — | |
| 1890 | 4,944 | 32.8% | |
| 1900 | 4,535 | −8.3% | |
| 1910 | 5,883 | 29.7% | |
| 1920 | 7,490 | 27.3% | |
| 1930 | 8,358 | 11.6% | |
| 1940 | 6,864 | −17.9% | |
| 1950 | 6,322 | −7.9% | |
| 1960 | 5,470 | −13.5% | |
| 1970 | 4,791 | −12.4% | |
| 1980 | 4,498 | −6.1% | |
| 1990 | 4,033 | −10.3% | |
| 2000 | 3,454 | −14.4% | |
| 2010 | 3,107 | −10.0% | |
| 2020 | 2,687 | −13.5% | |
| U.S. Decennial Census[5] 1790-1960[6] 1900-1990[7] 1990-2000[8] 2010-2020[1] | |||
Government
changePresidential elections
changePresidential Elections Results
| Year | Republican | Democratic | Third Parties |
|---|---|---|---|
| 2020 | 88.5% 1,339 | 9.8% 149 | 1.7% 25 |
| 2016 | 84.5% 1,228 | 11.1% 162 | 4.4% 64 |
| 2012 | 83.7% 1,209 | 15.1% 218 | 1.2% 17 |
| 2008 | 79.2% 1,207 | 19.0% 289 | 1.9% 29 |
| 2004 | 77.4% 1,407 | 21.0% 382 | 1.6% 29 |
| 2000 | 75.7% 1,420 | 20.4% 383 | 3.9% 73 |
| 1996 | 68.2% 1,336 | 21.8% 428 | 10.0% 196 |
| 1992 | 43.6% 967 | 25.5% 565 | 30.9% 686 |
| 1988 | 56.6% 1,230 | 40.8% 887 | 2.6% 57 |
| 1984 | 75.3% 1,779 | 22.9% 540 | 1.8% 43 |
| 1980 | 67.5% 1,657 | 25.1% 616 | 7.4% 182 |
| 1976 | 46.5% 1,016 | 50.6% 1,106 | 2.8% 62 |
| 1972 | 68.4% 1,539 | 29.0% 652 | 2.7% 60 |
| 1968 | 58.2% 1,352 | 33.0% 767 | 8.7% 203 |
| 1964 | 39.5% 1,034 | 59.7% 1,562 | 0.7% 19 |
| 1960 | 63.4% 1,683 | 36.2% 960 | 0.5% 12 |
| 1956 | 70.8% 1,876 | 28.6% 758 | 0.6% 16 |
| 1952 | 76.3% 2,288 | 22.1% 664 | 1.6% 48 |
| 1948 | 58.1% 1,689 | 38.9% 1,130 | 3.0% 88 |
| 1944 | 65.5% 1,745 | 32.9% 876 | 1.7% 45 |
| 1940 | 58.7% 1,826 | 39.5% 1,230 | 1.8% 56 |
| 1936 | 39.2% 1,302 | 60.3% 2,002 | 0.5% 18 |
| 1932 | 42.7% 1,409 | 53.6% 1,772 | 3.7% 123 |
| 1928 | 71.5% 2,058 | 27.2% 784 | 1.3% 36 |
| 1924 | 64.6% 1,629 | 21.5% 541 | 13.9% 350 |
| 1920 | 69.3% 1,402 | 24.3% 492 | 6.4% 129 |
| 1916 | 37.6% 927 | 49.2% 1,213 | 13.2% 324 |
| 1912 | 18.1% 232 | 35.8% 458 | 46.1% 590[a] |
| 1908 | 48.0% 635 | 34.8% 461 | 17.2% 228 |
| 1904 | 58.8% 687 | 16.1% 188 | 25.1% 293 |
| 1900 | 44.9% 511 | 51.2% 583 | 3.9% 44 |
| 1896 | 39.0% 354 | 58.0% 526 | 3.0% 27 |
| 1892 | 44.4% 495 | 55.6% 619 | |
| 1888 | 57.3% 891 | 30.2% 470 | 12.5% 195 |
Ness County is very overwhelmingly Republican. The last time a Democrat won the county was Jimmy Carter in 1976.
Education
changeUnified school districts
changeCommunities
changeCities
changeReferences
change- ↑ 1.0 1.1 1.2 "QuickFacts: Ness County, Kansas". United States Census Bureau. Retrieved October 3, 2023.
- ↑ "Find a County". National Association of Counties. Retrieved 2011-06-07.
- ↑ Kansas Place-Names,John Rydjord, University of Oklahoma Press, 1972, ISBN 0-8061-0994-7
- ↑ "US Gazetteer files: 2010, 2000, and 1990". United States Census Bureau. 2011-02-12. Retrieved 2011-04-23.
- ↑ "U.S. Decennial Census". United States Census Bureau. Retrieved July 27, 2014.
- ↑ "Historical Census Browser". University of Virginia Library. Archived from the original on August 11, 2012. Retrieved July 27, 2014.
- ↑ "Population of Counties by Decennial Census: 1900 to 1990". United States Census Bureau. Retrieved July 27, 2014.
- ↑ "Census 2000 PHC-T-4. Ranking Tables for Counties: 1990 and 2000" (PDF). United States Census Bureau. Retrieved July 27, 2014.
- ↑ "Dave Leip's Atlas of U.S. Presidential Elections".
- Notes
- ↑ This total comprises 464 votes (36.35 percent) for Progressive Theodore Roosevelt (who carried the county) and 126 votes (9.84 percent) for Socialist Eugene V. Debs.
More reading
change- Handbook of Ness County, Kansas; C.S. Burch Publishing Co; 42 pages; 1887.
- Standard Atlas of Ness County, Kansas; Geo. A. Ogle & Co; 64 pages; 1906.
Other websites
changeWikimedia Commons has media related to Ness County, Kansas.
- County
- Maps