Phillips County, Kansas
county in Kansas, United States
Phillips County (standard abbreviation: PL) is a county in the U.S. state of Kansas. In 2020, 4,981 people lived there.[1] The county seat is Phillipsburg. Phillipsburg is also the biggest city in Phillips County.[2]
Phillips County | |
|---|---|
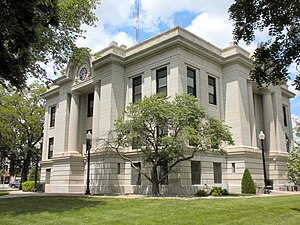
 Phillips County Courthouse in Phillipsburg (2010) | |
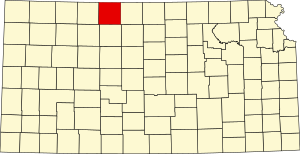
 Location within the U.S. state of Kansas | |
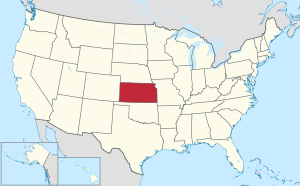
 Kansas's location within the U.S. | |
| Coordinates: 39°48′N 99°21′W / 39.800°N 99.350°W | |
| Country | |
| State | |
| Founded | February 26, 1867 |
| Named for | William A. Phillips |
| Seat | Phillipsburg |
| Largest city | Phillipsburg |
| Area | |
| • Total | 895 sq mi (2,320 km2) |
| • Land | 886 sq mi (2,290 km2) |
| • Water | 8.7 sq mi (23 km2) 1.0% |
| Population | |
| • Total | 4,981 |
| • Density | 5.6/sq mi (2.2/km2) |
| Time zone | UTC−6 (Central) |
| • Summer (DST) | UTC−5 (CDT) |
| Area code | 785 |
| Congressional district | 1st |
| Website | www |
History
changeIn 1867, Phillips County was created.
Geography
changeThe U.S. Census Bureau says that the county has a total area of 895 square miles (2,320 km2). Of that, 886 square miles (2,290 km2) is land and 8.7 square miles (23 km2) (1.0%) is water.[3]
People
change| Historical population | |||
|---|---|---|---|
| Census | Pop. | %± | |
| 1880 | 12,014 | — | |
| 1890 | 13,661 | 13.7% | |
| 1900 | 14,442 | 5.7% | |
| 1910 | 14,150 | −2.0% | |
| 1920 | 12,505 | −11.6% | |
| 1930 | 12,159 | −2.8% | |
| 1940 | 10,435 | −14.2% | |
| 1950 | 9,273 | −11.1% | |
| 1960 | 8,709 | −6.1% | |
| 1970 | 7,888 | −9.4% | |
| 1980 | 7,406 | −6.1% | |
| 1990 | 6,590 | −11.0% | |
| 2000 | 6,001 | −8.9% | |
| 2010 | 5,642 | −6.0% | |
| 2020 | 4,981 | −11.7% | |
| U.S. Decennial Census[4] 1790-1960[5] 1900-1990[6] 1990-2000[7] 2010-2020[1] | |||
Government
changePresidential elections
changePresidential election results
| Year | Republican | Democratic | Third Parties |
|---|---|---|---|
| 2020 | 86.9% 2,418 | 11.4% 318 | 1.6% 45 |
| 2016 | 83.8% 2,233 | 11.3% 300 | 4.9% 131 |
| 2012 | 83.2% 2,135 | 14.9% 382 | 1.9% 48 |
| 2008 | 78.9% 2,105 | 19.7% 525 | 1.4% 37 |
| 2004 | 79.2% 2,256 | 19.6% 557 | 1.2% 34 |
| 2000 | 73.7% 2,057 | 21.9% 611 | 4.4% 124 |
| 1996 | 66.3% 2,005 | 25.1% 758 | 8.6% 261 |
| 1992 | 46.6% 1,579 | 24.9% 843 | 28.5% 966 |
| 1988 | 69.9% 2,316 | 29.0% 960 | 1.2% 39 |
| 1984 | 80.9% 2,813 | 18.0% 626 | 1.1% 38 |
| 1980 | 74.5% 2,731 | 20.4% 748 | 5.1% 188 |
| 1976 | 63.1% 2,317 | 34.4% 1,264 | 2.6% 94 |
| 1972 | 76.2% 2,919 | 21.6% 827 | 2.3% 87 |
| 1968 | 68.3% 2,567 | 22.5% 844 | 9.3% 348 |
| 1964 | 54.1% 2,164 | 45.1% 1,804 | 0.8% 32 |
| 1960 | 75.3% 3,123 | 24.2% 1,004 | 0.4% 18 |
| 1956 | 75.5% 3,117 | 23.9% 985 | 0.7% 27 |
| 1952 | 80.2% 3,713 | 19.1% 884 | 0.7% 34 |
| 1948 | 66.3% 2,715 | 29.9% 1,223 | 3.8% 156 |
| 1944 | 72.7% 3,053 | 26.2% 1,098 | 1.1% 46 |
| 1940 | 69.5% 3,676 | 29.6% 1,563 | 1.0% 51 |
| 1936 | 59.6% 3,193 | 40.2% 2,154 | 0.2% 11 |
| 1932 | 40.6% 2,165 | 56.5% 3,007 | 2.9% 155 |
| 1928 | 69.8% 3,206 | 29.0% 1,332 | 1.2% 57 |
| 1924 | 55.0% 2,647 | 28.6% 1,376 | 16.5% 792 |
| 1920 | 68.6% 2,862 | 29.5% 1,230 | 1.9% 80 |
| 1916 | 41.8% 2,271 | 53.7% 2,912 | 4.5% 245 |
| 1912 | 18.7% 594 | 39.6% 1,257 | 41.7% 1,324[a] |
| 1908 | 52.3% 1,762 | 44.2% 1,490 | 3.6% 120 |
| 1904 | 66.4% 2,147 | 25.1% 811 | 8.5% 275 |
| 1900 | 52.3% 1,691 | 46.7% 1,511 | 1.1% 34 |
| 1896 | 47.2% 1,374 | 51.8% 1,507 | 1.0% 28 |
| 1892 | 47.8% 1,352 | 52.2% 1,477 | |
| 1888 | 53.9% 1,681 | 24.5% 763 | 21.7% 677 |
Phillips County is very Republican. No Democratic Presidential candidate has won Phillips County since Franklin D. Roosevelt in 1932.
Education
changeUnified school districts
change- Thunder Ridge USD 110 (Consolidation of Agra-Eastern Heights and Kensington-West Smith County)
- Agra and small eastern portion of county; extends into western third of Smith County
- Northern Valley USD 212
- Long Island and northwestern corner of county; extends into northeastern Norton County
- Phillipsburg USD 325
- city of Phillipsburg and areas near and along US 183
- Logan USD 326
- southwestern corner of county along and south of K-9; goes into southeastern Norton County
Communities
changeCities
changeReferences
change- ↑ 1.0 1.1 1.2 "QuickFacts: Phillips County, Kansas". United States Census Bureau. Retrieved October 3, 2023.
- ↑ "Find a County". National Association of Counties. Retrieved 2011-06-07.
- ↑ "US Gazetteer files: 2010, 2000, and 1990". United States Census Bureau. 2011-02-12. Retrieved 2011-04-23.
- ↑ "U.S. Decennial Census". United States Census Bureau. Retrieved July 28, 2014.
- ↑ "Historical Census Browser". University of Virginia Library. Archived from the original on August 11, 2012. Retrieved July 28, 2014.
- ↑ "Population of Counties by Decennial Census: 1900 to 1990". United States Census Bureau. Retrieved July 28, 2014.
- ↑ "Census 2000 PHC-T-4. Ranking Tables for Counties: 1990 and 2000" (PDF). United States Census Bureau. Retrieved July 28, 2014.
- ↑ "Dave Leip's Atlas of U.S. Presidential Elections".
- Notes
- ↑ This total comprises 1,181 votes (37.2%) for Progressive Theodore Roosevelt and 105 votes (4.3%) for Socialist Eugene V. Debs.
More reading
change- Standard Atlas of Phillips County, Kansas; Geo. A. Ogle & Co; 78 pages; 1917.
- Plat Book of Phillips County, Kansas; North West Publishing Co; 49 pages; 1900.
Other websites
changeWikimedia Commons has media related to Phillips County, Kansas.
- County
- Official website
- Phillips County - Directory of Public Officials
- Phillips County - Economic Development
- Maps