New York's 23rd congressional district
U.S. House District in Southwest New York State
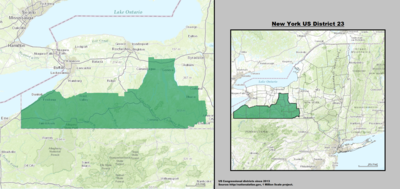
New York's 23rd congressional district is a congressional district in the state of New York. The district is in the southwest of New York and goes on the border of the state of Pennsylvania. The west side of the district is the shore of Lake Erie. The district has the counties of Allegany, Cattaraugus, Chautauqua, Chemung, Schuyler, Seneca, Steuben, Tompkins, and Yates county along with parts of Ontario and Tioga counties.[3] The district is currently represented by Republican Tom Reed.
| New York's 23rd congressional district | |||
|---|---|---|---|
 New York 's 23rd congressional district - since January 3, 2013. | |||
| Representative |
| ||
| Distribution |
| ||
| Population (2019) | 687,583 | ||
| Median household income | $53,769[1] | ||
| Ethnicity |
| ||
| Cook PVI | R+6[2] | ||
Election history
change| 1992 | President | GHW Bush 40 – 37% |
| 1996 | President | B Clinton 46 – 39% |
| 2000 | President | Bush 49 – 47% |
| 2004 | President | GW Bush 51 – 47% |
| 2008 | President | Obama 50 – 49% |
| 2012 | President | Romney 49.6 – 48.4% |
| 2016 | President | Trump 54.5 – 39.7% |
| US House election, 1984: New York District 23 | |||||
|---|---|---|---|---|---|
| Party | Candidate | Votes | % | ±% | |
| Democratic | Samuel S. Stratton | 188,144 | 77.8 | ||
| Republican | Frank Wicks | 53,060 | 21.9 | ||
| Socialist Workers | Richard Ariza | 642 | 0.3 | ||
| Majority | 135,084 | 55.9 | |||
| Turnout | 241,846 | 100 | |||
| US House election, 1996: New York District 23 | |||||
|---|---|---|---|---|---|
| Party | Candidate | Votes | % | ±% | |
| Republican | Sherwood Boehlert | 124,626 | 64.3 | ||
| Democratic | Bruce W. Hapanowicz | 50,436 | 26.0 | ||
| Independence | Thomas E. Loughlin, Jr. | 10,835 | 5.6 | ||
| Right to Life | William Tapley | 7,790 | 4.0 | ||
| Majority | 74,190 | 38.3 | |||
| Turnout | 193,687 | ||||
| US House election, 1998: New York District 23 | |||||
|---|---|---|---|---|---|
| Party | Candidate | Votes | % | ±% | |
| Republican | Sherwood Boehlert | 111,242 | 80.8 | +16.5 | |
| Conservative | David Vickers | 26,493 | 19.2 | +19.2 | |
| Majority | 84,749 | 61.5 | +23.2 | ||
| Turnout | 137,735 | -28.9 | |||
| US House election, 2000: New York District 23 | |||||
|---|---|---|---|---|---|
| Party | Candidate | Votes | % | ±% | |
| Republican | Sherwood Boehlert | 124,132 | 60.5 | -20.3 | |
| Conservative | David Vickers | 42,854 | 20.9 | +1.7 | |
| Democratic | Richard W. Englebrecht | 38,049 | 18.6 | +18.6 | |
| Majority | 81,278 | 39.6 | -21.9 | ||
| Turnout | 205,535 | +48.9 | |||
| US House election, 2002: New York District 23 | |||||
|---|---|---|---|---|---|
| Party | Candidate | Votes | % | ±% | |
| Republican | John M. McHugh | 124,682 | 100 | +39.5 | |
| Majority | 124,682 | 100 | +61.4 | ||
| Turnout | 124,682 | -39.2 | |||
| US House election, 2004: New York District 23 | |||||
|---|---|---|---|---|---|
| Party | Candidate | Votes | % | ±% | |
| Republican | John M. McHugh | 160,079 | 70.7 | -29.3 | |
| Democratic | Robert J. Johnson | 66,448 | 29.3 | +29.3 | |
| Majority | 93,631 | 41.3 | -59.7 | ||
| Turnout | 226,527 | +81.7 | |||
| US House election, 2006: New York District 23 | |||||
|---|---|---|---|---|---|
| Party | Candidate | Votes | % | ±% | |
| Republican | John M. McHugh | 106,781 | 63.1 | -7.6 | |
| Democratic | Robert J. Johnson | 62,318 | 36.9 | +7.6 | |
| Majority | 44,463 | 26.3 | -15.0 | ||
| Turnout | 169,099 | -25.4 | |||
| US House election, 2008: New York District 23 | |||||
|---|---|---|---|---|---|
| Party | Candidate | Votes | % | ±% | |
| Republican | John M. McHugh | 129,991 | 65.3 | +2.2 | |
| Democratic | Michael P. Oot | 69,112 | 34.7 | -2.2 | |
| Majority | 60,879 | 30.6 | |||
| Turnout | 199,103 | +17.7 | |||
| New York's 23rd congressional district special election, 2009 | |||||
|---|---|---|---|---|---|
| Party | Candidate | Votes | % | ±% | |
| Democratic | Bill Owens | 73,137 | 48.3 | +14.0 | |
| Conservative | Doug Hoffman | 69,553 | 46.0 | +25.1 (2000) | |
| Republican | Dede Scozzafava (withdrew, but still on the ballot)[4] |
8,582 | 5.7 | -59.6 | |
| Majority | 3,584 | 2.4 | -28.2 | ||
| Turnout | 151,272 | -24.0 | |||
| US House election, 2010: New York District 23 | |||||
|---|---|---|---|---|---|
| Party | Candidate | Votes | % | ±% | |
| Democratic | Bill Owens | 82,232 | 47.5 | -0.8 | |
| Republican | Matt Doheny | 80,237 | 46.4 | +40.7 | |
| Conservative | Doug Hoffman | 10,507 | 6.1 | -39.9 | |
| Majority | 1,995 | 1.2 | -1.2 | ||
| Turnout | 172,976 | +14.3 | |||
| Party | Candidate | Votes | % | |
|---|---|---|---|---|
| Republican | Tom Reed | 126,519 | 51.9 | |
| Democratic | Nate Shinagawa | 117,055 | 48.1 | |
| Total votes | 243,571 | 100.0 | ||
| Party | Candidate | Votes | % | |
|---|---|---|---|---|
| Republican | Tom Reed | 113,130 | 59.4 | |
| Democratic | Martha Robertson | 70,242 | 36.9 | |
| Total votes | 190,554 | 100.0 | ||
| Party | Candidate | Votes | % | |
|---|---|---|---|---|
| Republican | Tom Reed | 161,050 | 57.6 | |
| Democratic | John Plumb | 118,584 | 42.4 | |
| Total votes | 279,634 | 100.0 | ||
| Party | Candidate | Votes | % | |
|---|---|---|---|---|
| Republican | Tom Reed | 130,323 | 54.2 | |
| Democratic | Tracy Mitrano | 109,932 | 45.8 | |
| Total votes | 240,255 | 100.0 | ||
References
change- ↑ "My Congressional District". Archived from the original on 2021-06-29. Retrieved 2021-01-21.
- ↑ "Partisan Voting Index – Districts of the 115th Congress" (PDF). The Cook Political Report. April 7, 2017. Archived from the original (PDF) on June 7, 2017. Retrieved April 7, 2017.
- ↑ "Reed edges Shinagawa in 23rd District race - Corning, NY - the Corning Leader". Archived from the original on 2013-03-11. Retrieved 2014-06-19.
- ↑ "Republican in State House Race Suspends Campaign". New York Times. Associated Press. October 31, 2009. [dead link]
- ↑ "NYS Board of Elections Representatives in Congress Election Returns Nov. 8, 2016" (PDF). New York State Board of Elections. Archived (PDF) from the original on May 19, 2017. Retrieved May 7, 2017.