List of United States congressional districts
This article needs to be updated. (January 2023) |
Congressional districts in the United States are electoral divisions for electing members of the United States House of Representatives. There are now 435 voting seats in the House of Representatives. Each seat represents around 761,000 people.[1] There have been 435 voting seats since 1913, except for a temporary increase to 437 after the admissions of Alaska and Hawaii. The total number of state members is capped by the Reapportionment Act of 1929.[2] Also, each of the five inhabited U.S. territories and the federal district of Washington, D.C. sends a non-voting delegate to the House of Representatives.


The Bureau of the Census counts the number of people in the United States every ten years. This is called the decennial census. The numbers from the Census are used to figure out how many representavies each state gets. This is called "apportionment". The 2012 elections were the first to be based on the congressional districts which were defined based on the 2010 United States Census.[3]
Each state is in charge of the redistricting of districts within their state, and several states have one "at-large" division. Redistricting must take place if the number of members changes after a reapportionment, or may take place at any other time if demographics represented in a district has changed substantially. Districts may sometimes retain the same boundaries while changing their district numbers.
The following is a complete list of the 435 current congressional districts for the House of Representatives, and over 200 obsolete (no longer being used) districts, and the six current and one obsolete non-voting delegations.
Extremes
changePopulation
change- Average population: 761,169 people based on 2020 U.S. census.[1] It was 710,767 in 2010.
- State with the most people in the average district: Delaware (989,948).[1] In 2010, Montana: 994,416.
- State with the fewest people in the average district: Montana (542,113).[1] In 2010, Rhode Island: 527,624.
- District with the most people: Delaware at-large (989,948).[1] In 2010, Montana at-large: 994,416.
- District with the fewest people: Rhode Island's 1st (545,085).[4] In 2010, also Rhode Island's 1st: 526,283.
Area
change- District with the greatest area: Alaska at-large, same as in 2010.
- District with the greatest area that comprises less than an entire state: Montana's 2nd. In 2010: New Mexico's 2nd.
- District with the smallest area: New York's 12th. In 2010: New York's 13th.
Oldest district
change- Delaware at-large, same geographical borders since 1789.
American Human Development Index
change- District with the highest American Human Development Index score: California's 18th.
- District with the lowest American Human Development Index score: New York's 15th.[5]
Alabama
change
- Territory: 1818–1819 (obsolete since statehood)
- At-large: 1819–1823, 1841–1843, 1873–1877, 1913–1917, 1963–1965 (obsolete)
- 1st district: 1823–1841, 1843–1963, 1965–present
- 2nd district: 1823–1841, 1843–1963, 1965–present
- 3rd district: 1823–1841, 1843–1963, 1965–present
- 4th district: 1833–1841, 1843–1963, 1965–present
- 5th district: 1833–1841, 1843–1963, 1965–present
- 6th district: 1843–1963, 1965–present
- 7th district: 1843–1863, 1877–1963, 1965–present
- 8th district: 1877–1963, 1965–1973 (obsolete since the 1970 census)
- 9th district: 1893–1963 (obsolete since the 1960 census)
- 10th district: 1917–1933 (obsolete since the 1930 census)
Alaska
change
American Samoa
changeSee Non-voting delegations, below.
Arizona
change
- Territory: 1863–1912 (obsolete since statehood)
- At-large: 1912–1949 (obsolete)
- 1st district: 1949–present
- 2nd district: 1949–present
- 3rd district: 1963–present
- 4th district: 1973–present
- 5th district: 1983–present
- 6th district: 1993–present
- 7th district: 2003–present
- 8th district: 2003–present
- 9th district: 2013–present
Arkansas
change
- Territory: 1819–1836 (obsolete since statehood)
- At-large: 1836–1853, 1873–1875, 1883–1885 (obsolete)
- 1st district: 1853–present
- 2nd district: 1853–present
- 3rd district: 1863–present
- 4th district: 1875–present
- 5th district: 1885–1963 (obsolete since the 1960 census)
- 6th district: 1893–1963 (obsolete since the 1960 census)
- 7th district: 1903–1953 (obsolete since the 1950 census)
California
change
- At-large: 1849–1865, 1883–1885 (obsolete)
- 1st district: 1865–present
- 2nd district: 1865–present
- 3rd district: 1865–present
- 4th district: 1873–present
- 5th district: 1885–present
- 6th district: 1885–present
- 7th district: 1893–present
- 8th district: 1903–present
- 9th district: 1913–present
- 10th district: 1913–present
- 11th district: 1913–present
- 12th district: 1933–present
- 13th district: 1933–present
- 14th district: 1933–present
- 15th district: 1933–present
- 16th district: 1933–present
- 17th district: 1933–present
- 18th district: 1933–present
- 19th district: 1933–present
- 20th district: 1933–present
- 21st district: 1943–present
- 22nd district: 1943–present
- 23rd district: 1943–present
- 24th district: 1953–present
- 25th district: 1953–present
- 26th district: 1953–present
- 27th district: 1953–present
- 28th district: 1953–present
- 29th district: 1953–present
- 30th district: 1953–present
- 31st district: 1963–present
- 32nd district: 1963–present
- 33rd district: 1963–present
- 34th district: 1963–present
- 35th district: 1963–present
- 36th district: 1963–present
- 37th district: 1963–present
- 38th district: 1963–present
- 39th district: 1973–present
- 40th district: 1973–present
- 41st district: 1973–present
- 42nd district: 1973–present
- 43rd district: 1973–present
- 44th district: 1983–present
- 45th district: 1983–present
- 46th district: 1993–present
- 47th district: 1993–present
- 48th district: 1993–present
- 49th district: 1993–present
- 50th district: 1993–present
- 51st district: 1993–present
- 52nd district: 1993–present
- 53rd district: 2003–2023 (obsolete due to the 2020 census)
Colorado
change
- Territory: 1861–1876 (obsolete since statehood)
- At-large: 1876–1893, 1903–1915 (obsolete)
- 1st district: 1893–present
- 2nd district: 1893–present
- 3rd district: 1915–present
- 4th district: 1915–present
- 5th district: 1973–present
- 6th district: 1983–present
- 7th district: 2003–present
- 8th district: 2023–present
Connecticut
change
- At-large: 1789–1837, 1903–1913, 1933–1965 (obsolete)
- 1st district: 1837–present
- 2nd district: 1837–present
- 3rd district: 1837–present
- 4th district: 1837–present
- 5th district: 1837–1843, 1913–present
- 6th district: 1837–1843, 1965–2003 (obsolete since the 2000 census)
Delaware
change
- At-large: 1789–present
The oldest district in the country, it has never changed its shape or size. From 1813 to 1823, Delaware had two representatives — both chosen at-large on a general ticket from the same statewide district.
District of Columbia
changeSee Non-voting delegations, below.
Florida
change
- Territory: 1822–1845 (obsolete since statehood)
- At-large: 1845–1875, 1913–1915, 1933–1937, 1943–1945 (obsolete)
- 1st district: 1875–present
- 2nd district: 1875–present
- 3rd district: 1903–present
- 4th district: 1915–present
- 5th district: 1937–present
- 6th district: 1945–present
- 7th district: 1953–present
- 8th district: 1953–present
- 9th district: 1963–present
- 10th district: 1963–present
- 11th district: 1963–present
- 12th district: 1963–present
- 13th district: 1973–present
- 14th district: 1973–present
- 15th district: 1973–present
- 16th district: 1983–present
- 17th district: 1983–present
- 18th district: 1983–present
- 19th district: 1983–present
- 20th district: 1993–present
- 21st district: 1993–present
- 22nd district: 1993–present
- 23rd district: 1993–present
- 24th district: 2003–present
- 25th district: 2003–present
- 26th district: 2013–present
- 27th district: 2013–present
- 28th district: 2023–present
Georgia
change
- At-large: 1793–1827, 1829–1845, 1883–1885 (obsolete)
- 1st district: 1789–1793, 1827–1829, 1845–present
- 2nd district: 1789–1793, 1827–1829, 1845–present
- 3rd district: 1789–1793, 1827–1829, 1845–present
- 4th district: 1827–1829, 1845–present
- 5th district: 1827–1829, 1845–present
- 6th district: 1827–1829, 1845–present
- 7th district: 1827–1829, 1845–present
- 8th district: 1845–1863, 1873–present
- 9th district: 1873–present
- 10th district: 1885–present
- 11th district: 1893–1933, 1993–present
- 12th district: 1913–1933, 2003–present
- 13th district: 2003–present
- 14th district: 2013–present
Guam
changeSee Non-voting delegations, below.
Hawaii
change
- Territory: 1900–1959 (obsolete since statehood)
- At-large: 1959–1971 (obsolete)
- 1st district: 1971–present
- 2nd district: 1971–present
Idaho
change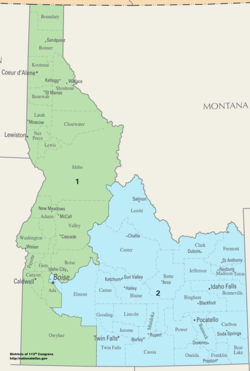
- Territory: 1864–1890 (obsolete since statehood)
- At-large: 1890–1919 (obsolete)
- 1st district: 1919–present
- 2nd district: 1919–present
Illinois
change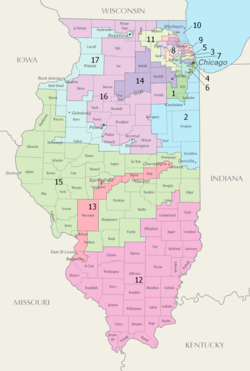
- Territory: 1812–1818 (obsolete since statehood)
- At-large: 1818–1833, 1863–1873, 1893–1895, 1913–1949 (obsolete)
- 1st district: 1833–present
- 2nd district: 1833–present
- 3rd district: 1833–present
- 4th district: 1843–present
- 5th district: 1843–present
- 6th district: 1843–present
- 7th district: 1843–present
- 8th district: 1853–present
- 9th district: 1853–present
- 10th district: 1863–present
- 11th district: 1863–present
- 12th district: 1863–present
- 13th district: 1863–present
- 14th district: 1873–present
- 15th district: 1873–present
- 16th district: 1873–present
- 17th district: 1873–present
- 18th district: 1873–2023 (obsolete due to the 2020 census)
- 19th district: 1873–2013 (obsolete since the 2010 census)
- 20th district: 1883–2003 (obsolete since the 2000 census)
- 21st district: 1895–1993 (obsolete since the 1990 census)
- 22nd district: 1895–1993 (obsolete since the 1990 census)
- 23rd district: 1903–1983 (obsolete since the 1980 census)
- 24th district: 1903–1983 (obsolete since the 1980 census)
- 25th district: 1903–1963 (obsolete since the 1960 census)
- 26th district: 1949–1953 (obsolete since the 1950 census)
Indiana
change.png)
- Territory: 1805–1816 (obsolete since statehood)
- At-large: 1816–1823, 1873–1875 (obsolete)
- 1st district: 1823–present
- 2nd district: 1823–present
- 3rd district: 1823–present
- 4th district: 1833–present
- 5th district: 1833–present
- 6th district: 1833–present
- 7th district: 1833–present
- 8th district: 1843–present
- 9th district: 1843–present
- 10th district: 1843–2003 (obsolete since the 2000 census)
- 11th district: 1853–1983 (obsolete since the 1980 census)
- 12th district: 1875–1943 (obsolete since the 1940 census)
- 13th district: 1875–1933 (obsolete since the 1930 census)
Iowa
change
- Territory: 1838–1846 (obsolete since statehood)
- At-large: 1846–1847 (obsolete)
- 1st district: 1847–present
- 2nd district: 1847–present
- 3rd district: 1863–present
- 4th district: 1863–present
- 5th district: 1863–2013 (obsolete since the 2010 census)
- 6th district: 1863–1993 (obsolete since the 1990 census)
- 7th district: 1873–1973 (obsolete since the 1970 census)
- 8th district: 1873–1963 (obsolete since the 1960 census)
- 9th district: 1873–1943 (obsolete since the 1940 census)
- 10th district: 1883–1933 (obsolete since the 1930 census)
- 11th district: 1883–1933 (obsolete since the 1930 census)
Kansas
change
- Territory: 1854–1861 (obsolete since statehood)
- At-large: 1861–1875, 1883–1885, 1893–1907 (obsolete)
- 1st district: 1875–present
- 2nd district: 1875–present
- 3rd district: 1875–present
- 4th district: 1885–present
- 5th district: 1885–1993 (obsolete since the 1990 census)
- 6th district: 1885–1963 (obsolete since the 1960 census)
- 7th district: 1885–1943 (obsolete since the 1940 census)
- 8th district: 1907–1933 (obsolete since the 1930 census)
Kentucky
change
- At-large: 1933–1935 (obsolete)
- 1st district: 1792–1933, 1935–present
- 2nd district: 1792–1933, 1935–present
- 3rd district: 1803–1933, 1935–present
- 4th district: 1803–1933, 1935–present
- 5th district: 1803–1933, 1935–present
- 6th district: 1803–1933, 1935–present
- 7th district: 1813–1933, 1935–1993 (obsolete since the 1990 census)
- 8th district: 1813–1933, 1935–1963 (obsolete since the 1960 census)
- 9th district: 1813–1933, 1935–1953 (obsolete since the 1950 census)
- 10th district: 1813–1863, 1873–1933 (obsolete since the 1930 census)
- 11th district: 1823–1843, 1883–1933 (obsolete since the 1930 census)
- 12th district: 1823–1843 (obsolete since the 1840 census)
- 13th district: 1833–1843 (obsolete since the 1840 census)
Louisiana
change
- Orleans Territory: 1806–1812 (obsolete since statehood)
- At-large: 1812–1823, 1873–1875 (obsolete)
- 1st district: 1823–present
- 2nd district: 1823–present
- 3rd district: 1823–present
- 4th district: 1843–present
- 5th district: 1863–present
- 6th district: 1875–present
- 7th district: 1903–2013 (obsolete since the 2010 census)
- 8th district: 1913–1993 (obsolete since the 1990 census)
Maine
change.png)
Until 1820, Maine was part of Massachusetts. After the 1810 census, Massachusetts was allocated 20 districts. Seven Massachusetts districts (then numbered 14 through 20) were credited to Maine soon after it became a state in 1820. See District of Maine.
- At-large: 1820–1821, 1883–1885 (obsolete)
- 1st district: 1821–1883, 1885–present
- 2nd district: 1821–1883, 1885–present
- 3rd district: 1821–1883, 1885–1963 (obsolete since the 1960 census)
- 4th district: 1821–1883, 1885–1933 (obsolete since the 1930 census)
- 5th district: 1821–1883 (obsolete since the 1880 census)
- 6th district: 1821–1863 (obsolete since the 1860 census)
- 7th district: 1821–1853 (obsolete since the 1850 census)
- 8th district: 1833–1843 (obsolete since the 1840 census)
Maryland
change
- At-large: 1963–1967 (obsolete)
- 1st district: 1789–present
- 2nd district: 1789–present
- 3rd district: 1789–present
- 4th district: 1789–present
- 5th district: 1789–present
- 6th district: 1789–1863, 1873–present
- 7th district: 1793–1843, 1953–present
- 8th district: 1793–1835, 1967–present
Massachusetts
change
- At-large: 1793–1795 (obsolete)
- 1st district: 1789–present
- 2nd district: 1789–present
- 3rd district: 1789–present
- 4th district: 1789–present
- 5th district: 1789–1793, 1795–present
- 6th district: 1789–1793, 1795–present
- 7th district: 1789–1793, 1795–present
- 8th district: 1789–1793, 1795–present
- 9th district: 1795–present
- 10th district: 1795–2013 (obsolete since the 2010 census)
- 11th district: 1795–1843, 1853–1863, 1873–1993 (obsolete since the 1990 census)
- 12th district: 1795–1843, 1883–1983 (obsolete since the 1980 census)
- 13th district: 1795–1833, 1893–1963 (obsolete since the 1960 census)
- 14th district: 1795–1820 (moved to Maine), 1903–1963 (obsolete since the 1960 census)
- 15th district: 1803–1820 (moved to Maine), 1913–1943 (obsolete since the 1940 census)
- 16th district: 1803–1820 (moved to Maine), 1913–1933 (obsolete since the 1930 census)
- 17th district: 1803–1820 (obsolete since 1820 move to Maine[notes 1])
- 18th district: 1813–1820 (obsolete since 1820 move to Maine[notes 1])
- 19th district: 1813–1820 (obsolete since 1820 move to Maine[notes 1])
- 20th district: 1813–1820 (obsolete since 1820 move to Maine[notes 1])
Michigan
change
- Territory: 1819–1837 (obsolete since statehood)
- At-large: 1837–1843, 1913–1915, 1963–1965 (obsolete)
- 1st district: 1843–present
- 2nd district: 1843–present
- 3rd district: 1843–present
- 4th district: 1853–present
- 5th district: 1863–present
- 6th district: 1863–present
- 7th district: 1873–present
- 8th district: 1873–present
- 9th district: 1873–present
- 10th district: 1883–present
- 11th district: 1883–present
- 12th district: 1893–present
- 13th district: 1915–present
- 14th district: 1933–2023 (obsolete since the 2020 census)
- 15th district: 1933–2013 (obsolete since the 2010 census)
- 16th district: 1933–2003 (obsolete since the 2000 census)
- 17th district: 1933–1993 (obsolete since the 1990 census)
- 18th district: 1953–1993 (obsolete since the 1990 census)
- 19th district: 1965–1983 (obsolete since the 1980 census)
Minnesota
change
- Territory: 1849–1858 (obsolete since statehood)
- At-large: 1858–1863, 1913–1915, 1933–1935 (obsolete)
- 1st district: 1863–1933, 1935–present
- 2nd district: 1863–1933, 1935–present
- 3rd district: 1873–1933, 1935–present
- 4th district: 1883–1933, 1935–present
- 5th district: 1883–1933, 1935–present
- 6th district: 1893–1933, 1935–present
- 7th district: 1893–1933, 1935–present
- 8th district: 1903–1933, 1935–present
- 9th district: 1903–1933, 1935–1963 (obsolete since the 1960 census)
- 10th district: 1915–1933 (obsolete since the 1930 census)
Mississippi
change
- Territory: 1801–1817 (obsolete since statehood)
- At-large: 1817–1847, 1853–1855 (obsolete)
- 1st district: 1847–present
- 2nd district: 1847–present
- 3rd district: 1847–present
- 4th district: 1847–present
- 5th district: 1855–2003 (obsolete since the 2000 census)
- 6th district: 1873–1963 (obsolete since the 1960 census)
- 7th district: 1883–1953 (obsolete since the 1950 census)
- 8th district: 1903–1933 (obsolete since the 1930 census)
Missouri
change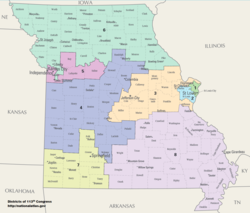
- Territory: 1812–1821 (obsolete since statehood)
- At-large: 1821–1847, 1933–1935 (obsolete)
- 1st district: 1847–1933, 1935–present
- 2nd district: 1847–1933, 1935–present
- 3rd district: 1847–1933, 1935–present
- 4th district: 1847–1933, 1935–present
- 5th district: 1847–1933, 1935–present
- 6th district: 1853–1933, 1935–present
- 7th district: 1853–1933, 1935–present
- 8th district: 1863–1933, 1935–present
- 9th district: 1863–1933, 1935–2013 (obsolete since the 2010 census)
- 10th district: 1873–1933, 1935–1983 (obsolete since the 1980 census)
- 11th district: 1873–1933, 1935–1963 (obsolete since the 1960 census)
- 12th district: 1873–1933, 1935–1953 (obsolete since the 1950 census)
- 13th district: 1873–1933, 1935–1953 (obsolete since the 1950 census)
- 14th district: 1883–1933 (obsolete since the 1930 census)
- 15th district: 1893–1933 (obsolete since the 1930 census)
- 16th district: 1903–1933 (obsolete since the 1930 census)
Montana
change
- Territory: 1865–1889 (obsolete since statehood)
- At-large: 1889–1919, 1993–2023 (obsolete)
- 1st district: 1919–1993, 2023–present
- 2nd district: 1919–1993, 2023–present
Nebraska
change
- Territory: 1855–1867 (obsolete since statehood)
- At-large: 1867–1883 (obsolete)
- 1st district: 1883–present
- 2nd district: 1883–present
- 3rd district: 1883–present
- 4th district: 1893–1963 (obsolete since the 1960 census)
- 5th district: 1893–1943 (obsolete since the 1940 census)
- 6th district: 1893–1933 (obsolete since the 1930 census)
Nevada
change
- Territory: 1861–1864 (obsolete since statehood)
- At-large: 1864–1983 (obsolete)
- 1st district: 1983–present
- 2nd district: 1983–present
- 3rd district: 2003–present
- 4th district: 2013–present
New Hampshire
change
- At-large: 1789–1847 (obsolete)
- 1st district: 1847–present
- 2nd district: 1847–present
- 3rd district: 1847–1883 (obsolete since the 1880 census)
- 4th district: 1847–1853 (obsolete since the 1850 census)
New Jersey
change
- At-large: 1789–1799, 1801–1813, 1815–1843 (obsolete)
- 1st district: 1799–1801, 1813–1815, 1843–present
- 2nd district: 1799–1801, 1813–1815, 1843–present
- 3rd district: 1799–1801, 1813–1815, 1843–present
- 4th district: 1799–1801, 1843–present
- 5th district: 1799–1801, 1843–present
- 6th district: 1873–present
- 7th district: 1873–present
- 8th district: 1893–present
- 9th district: 1903–present
- 10th district: 1903–present
- 11th district: 1913–present
- 12th district: 1913–present
- 13th district: 1933–2013 (obsolete since the 2010 census)
- 14th district: 1933–1993 (obsolete since the 1990 census)
- 15th district: 1963–1983 (obsolete since the 1980 census)
New Mexico
change
- Territory: 1851–1912 (obsolete since statehood)
- At-large: 1912–1969 (obsolete)
- 1st district: 1969–present
- 2nd district: 1969–present
- 3rd district: 1983–present
New York
change
- At-large: 1873–1875, 1883–1885, 1933–1945 (obsolete)
- 1st district: 1789–present
- 2nd district: 1789–present
- 3rd district: 1789–present
- 4th district: 1789–present
- 5th district: 1789–present
- 6th district: 1789–present
- 7th district: 1793–present
- 8th district: 1793–present
- 9th district: 1793–present
- 10th district: 1793–present
- 11th district: 1803–present
- 12th district: 1803–present
- 13th district: 1803–present
- 14th district: 1803–present
- 15th district: 1803–present
- 16th district: 1803–1809, 1813–present
- 17th district: 1803–1809, 1813–present
- 18th district: 1813–present
- 19th district: 1813–present
- 20th district: 1813–present
- 21st district: 1813–present
- 22nd district: 1821–present
- 23rd district: 1823–present
- 24th district: 1823–present
- 25th district: 1823–present
- 26th district: 1823–present
- 27th district: 1823–2023 (obsolete due to the 2020 census)
- 28th district: 1823–2013 (obsolete since the 2010 census)
- 29th district: 1823–2013 (obsolete since the 2010 census)
- 30th district: 1823–2003 (obsolete since the 2000 census)
- 31st district: 1833–2003 (obsolete since the 2000 census)
- 32nd district: 1833–1863, 1873–1993 (obsolete since the 1990 census)
- 33rd district: 1833–1863, 1875–1993 (obsolete since the 1990 census)
- 34th district: 1843–1853, 1885–1993 (obsolete since the 1990 census)
- 35th district: 1903–1983 (obsolete since the 1980 census)
- 36th district: 1903–1983 (obsolete since the 1980 census)
- 37th district: 1903–1983 (obsolete since the 1980 census)
- 38th district: 1913–1983 (obsolete since the 1980 census)
- 39th district: 1913–1983 (obsolete since the 1980 census)
- 40th district: 1913–1973 (obsolete since the 1970 census)
- 41st district: 1913–1973 (obsolete since the 1970 census)
- 42nd district: 1913–1963 (obsolete since the 1960 census)
- 43rd district: 1913–1963 (obsolete since the 1960 census)
- 44th district: 1945–1953 (obsolete since the 1950 census)
- 45th district: 1945–1953 (obsolete since the 1950 census)
North Carolina
change.svg)
- At-large: 1883–1885 (obsolete)
- 1st district: 1789–present
- 2nd district: 1789–present
- 3rd district: 1789–present
- 4th district: 1789–present
- 5th district: 1789–present
- 6th district: 1793–present
- 7th district: 1793–present
- 8th district: 1793–1863, 1873–present
- 9th district: 1793–1853, 1885–present
- 10th district: 1793–1843, 1903–present
- 11th district: 1803–1843, 1933–present
- 12th district: 1803–1843, 1943–1963, 1993–present
- 13th district: 1813–1843, 2003–present
- 14th district: 2023–present
North Dakota
change
- Dakota Territory: 1861–1889 (obsolete since statehood)
- At-large: 1889–1913, 1933–1963, 1973–present
- 1st district: 1913–1933, 1963–1973 (obsolete since the 1970 census)
- 2nd district: 1913–1933, 1963–1973 (obsolete since the 1970 census)
- 3rd district: 1913–1933 (obsolete since the 1930 census)
Northern Mariana Islands
change- See Non-voting delegations, below.
Ohio
change
- Northwest Territory: 1799–1803 (obsolete since statehood)
- At-large: 1803–1813, 1913–1915, 1933–1953, 1963–1967 (obsolete)
- 1st district: 1813–present
- 2nd district: 1813–present
- 3rd district: 1813–present
- 4th district: 1813–present
- 5th district: 1813–present
- 6th district: 1813–present
- 7th district: 1823–present
- 8th district: 1823–present
- 9th district: 1823–present
- 10th district: 1823–present
- 11th district: 1823–present
- 12th district: 1823–present
- 13th district: 1823–present
- 14th district: 1823–present
- 15th district: 1833–present
- 16th district: 1833–2023 (obsolete due to the 2020 census)
- 17th district: 1833–2013 (obsolete since the 2010 census)
- 18th district: 1833–2013 (obsolete since the 2010 census)
- 19th district: 1833–2003 (obsolete since the 2000 census)
- 20th district: 1843–1863, 1873–1993 (obsolete since the 1990 census)
- 21st district: 1843–1863, 1883–1993 (obsolete since the 1990 census)
- 22nd district: 1915–1983 (obsolete since the 1980 census)
- 23rd district: 1953–1983 (obsolete since the 1980 census)
- 24th district: 1967–1973 (obsolete since the 1970 census)
Oklahoma
change- Territory: 1890–1907 (obsolete since statehood)
- At-large: 1913–1915, 1933–1943 (obsolete)
- 1st district: 1907–present
- 2nd district: 1907–present
- 3rd district: 1907–present
- 4th district: 1907–present
- 5th district: 1907–present
- 6th district: 1915–2003 (obsolete since the 2000 census)
- 7th district: 1915–1953 (obsolete since the 1950 census)
- 8th district: 1915–1953 (obsolete since the 1950 census)
Oregon
change
- Territory: 1849–1859 (obsolete since statehood)
- At-large: 1859–1893 (obsolete)
- 1st district: 1893–present
- 2nd district: 1893–present
- 3rd district: 1913–present
- 4th district: 1943–present
- 5th district: 1983–present
- 6th district: 2023–present
Pennsylvania
change
- At-large: 1789–1791, 1793–1795, 1873–1875, 1883–1889, 1893–1903, 1913–1923, 1943–1945 (obsolete)
- 1st district: 1791–1793, 1795–present
- 2nd district: 1791–1793, 1795–present
- 3rd district: 1791–1793, 1795–present
- 4th district: 1791–1793, 1795–present
- 5th district: 1791–1793, 1795–present
- 6th district: 1791–1793, 1795–present
- 7th district: 1791–1793, 1795–present
- 8th district: 1791–1793, 1795–present
- 9th district: 1795–present
- 10th district: 1795–present
- 11th district: 1795–present
- 12th district: 1795–1803, 1813–present
- 13th district: 1813–present
- 14th district: 1813–present
- 15th district: 1813–present
- 16th district: 1823–present
- 17th district: 1823–present
- 18th district: 1823–2023 (obsolete due to the 2020 census)
- 19th district: 1833–2013 (obsolete since the 2010 census)
- 20th district: 1833–2003 (obsolete since the 2000 census)
- 21st district: 1833–2003 (obsolete since the 2000 census)
- 22nd district: 1833–1993 (obsolete since the 1990 census)
- 23rd district: 1833–1993 (obsolete since the 1990 census)
- 24th district: 1833–1983 (obsolete since the 1980 census)
- 25th district: 1833–1843, 1853–1863, 1875–1983 (obsolete since the 1980 census)
- 26th district: 1875–1973 (obsolete since the 1970 census)
- 27th district: 1875–1973 (obsolete since the 1970 census)
- 28th district: 1889–1963 (obsolete since the 1960 census)
- 29th district: 1903–1963 (obsolete since the 1960 census)
- 30th district: 1903–1963 (obsolete since the 1960 census)
- 31st district: 1903–1953 (obsolete since the 1950 census)
- 32nd district: 1903–1953 (obsolete since the 1950 census)
- 33rd district: 1923–1953 (obsolete since the 1950 census)
- 34th district: 1923–1943 (obsolete since the 1940 census)
- 35th district: 1923–1933 (obsolete since the 1930 census)
- 36th district: 1923–1933 (obsolete since the 1930 census)
Philippines
change- See Non-voting delegations, below.
Puerto Rico
change- See Non-voting delegations, below.
Rhode Island
change
- At-large: 1790–1843 (obsolete)
- 1st district: 1843–present
- 2nd district: 1843–present
- 3rd district: 1913–1933 (obsolete since the 1930 census)
South Carolina
change
- At-large: 1873–1875 (obsolete)
- 1st district: 1789–present
- 2nd district: 1789–present
- 3rd district: 1789–present
- 4th district: 1789–present
- 5th district: 1789–1863, 1875–present
- 6th district: 1793–1863, 1883–present
- 7th district: 1803–1853, 1883–1933, 2013–present
- 8th district: 1803–1843 (obsolete since the 1840 census)
- 9th district: 1813–1843 (obsolete since the 1840 census)
South Dakota
change
- Dakota Territory 1861–1889 (obsolete since statehood)
- At-large: 1889–1913, 1983–present
- 1st district: 1913–1983 (obsolete since the 1980 census)
- 2nd district: 1913–1983 (obsolete since the 1980 census)
- 3rd district: 1913–1933 (obsolete since the 1930 census)
Tennessee
change.png)
- Southwest Territory: 1794–1796 (obsolete since statehood)
- At-large: 1796–1805, 1873–1875 (obsolete)
- 1st district: 1805–present
- 2nd district: 1805–present
- 3rd district: 1805–present
- 4th district: 1813–present
- 5th district: 1813–present
- 6th district: 1813–present
- 7th district: 1823–present
- 8th district: 1823–present
- 9th district: 1823–1863, 1873–1973, 1983–present
- 10th district: 1833–1863, 1875–1933, 1943–1953 (obsolete since the 1950 census)
- 11th district: 1833–1853 (obsolete since the 1850 census)
- 12th district: 1833–1843 (obsolete since the 1840 census)
- 13th district: 1833–1843 (obsolete since the 1840 census)
Texas
change
- At-large: 1873–1875, 1913–1919, 1933–1935, 1953–1959, 1963–1967 (obsolete)
- 1st district: 1845–present
- 2nd district: 1845–present
- 3rd district: 1863–present
- 4th district: 1863–present
- 5th district: 1875–present
- 6th district: 1875–present
- 7th district: 1883–present
- 8th district: 1883–present
- 9th district: 1883–present
- 10th district: 1883–present
- 11th district: 1883–present
- 12th district: 1893–present
- 13th district: 1893–present
- 14th district: 1903–present
- 15th district: 1903–present
- 16th district: 1903–present
- 17th district: 1919–present
- 18th district: 1919–present
- 19th district: 1935–present
- 20th district: 1935–present
- 21st district: 1935–present
- 22nd district: 1959–present
- 23rd district: 1967–present
- 24th district: 1973–present
- 25th district: 1983–present
- 26th district: 1983–present
- 27th district: 1983–present
- 28th district: 1993–present
- 29th district: 1993–present
- 30th district: 1993–present
- 31st district: 2003–present
- 32nd district: 2003–present
- 33rd district: 2013–present
- 34th district: 2013–present
- 35th district: 2013–present
- 36th district: 2013–present
- 37th district: 2023–present
- 38th district: 2023–present
U.S. Virgin Islands
change- See Non-voting delegations, below.
Utah
change
- Territory: 1851–1896 (obsolete since statehood)
- At-large: 1896–1913 (obsolete)
- 1st district: 1913–present
- 2nd district: 1913–present
- 3rd district: 1983–present
- 4th district: 2013–present
Vermont
change
- At-large: 1813–1821, 1823–1825, 1933–present
- 1st district: 1791–1813, 1821–1823, 1825–1933 (obsolete since the 1930 census)
- 2nd district: 1791–1813, 1821–1823, 1825–1933 (obsolete since the 1930 census)
- 3rd district: 1803–1813, 1821–1823, 1825–1883 (obsolete since the 1880 census)
- 4th district: 1803–1813, 1821–1823, 1825–1853 (obsolete since the 1850 census)
- 5th district: 1821–1823, 1825–1843 (obsolete since the 1840 census)
- 6th district: 1821–1823 (obsolete since the 1820 census)
Virginia
change
- At-large: 1883–1885, 1933–1935 (obsolete)
- 1st district: 1789–1933, 1935–present
- 2nd district: 1789–1933, 1935–present
- 3rd district: 1789–1933, 1935–present
- 4th district: 1789–1933, 1935–present
- 5th district: 1789–1933, 1935–present
- 6th district: 1789–1933, 1935–present
- 7th district: 1789–1933, 1935–present
- 8th district: 1789–1933, 1935–present
- 9th district: 1789–1863, 1873–1933, 1935–present
- 10th district: 1789–1863, 1885–1933, 1953–present
- 11th district: 1793–1863, 1993–present
- 12th district: 1793–1863 (obsolete since the 1863 move to West Virginia)
- 13th district: 1793–1863 (obsolete since the 1863 move to West Virginia)
- 14th district: 1793–1853 (obsolete since the 1850 census)
- 15th district: 1793–1853 (obsolete since the 1850 census)
- 16th district: 1793–1843 (obsolete since the 1840 census)
- 17th district: 1793–1843 (obsolete since the 1840 census)
- 18th district: 1793–1843 (obsolete since the 1840 census)
- 19th district: 1793–1843 (obsolete since the 1840 census)
- 20th district: 1803–1843 (obsolete since the 1840 census)
- 21st district: 1803–1843 (obsolete since the 1840 census)
- 22nd district: 1803–1833 (obsolete since the 1830 census)
- 23rd district: 1813–1823 (obsolete since the 1820 census)
Washington
change
- Territory: 1854–1889 (obsolete since statehood)
- At-large: 1889–1909, 1913–1915, 1953–1959 (obsolete)
- 1st district: 1909–present
- 2nd district: 1909–present
- 3rd district: 1909–present
- 4th district: 1915–present
- 5th district: 1915–present
- 6th district: 1933–present
- 7th district: 1959–present
- 8th district: 1983–present
- 9th district: 1993–present
- 10th district: 2013–present
West Virginia
change.png)
- At-large: 1913–1917 (obsolete)
- 1st district: 1863–present
- 2nd district: 1863–present
- 3rd district: 1863–2023 (obsolete due to the 2020 census)
- 4th district: 1883–1993 (obsolete since the 1990 census)
- 5th district: 1903–1973 (obsolete since the 1970 census)
- 6th district: 1917–1963 (obsolete since the 1960 census)
Wisconsin
change
- Territory: 1836–1848 (obsolete since statehood)
- 1st district: 1848–present
- 2nd district: 1848–present
- 3rd district: 1849–present
- 4th district: 1863–present
- 5th district: 1863–present
- 6th district: 1863–present
- 7th district: 1873–present
- 8th district: 1873–present
- 9th district: 1883–2003 (obsolete since the 2000 census)
- 10th district: 1893–1973 (obsolete since the 1970 census)
- 11th district: 1903–1933 (obsolete since the 1930 census)
Wyoming
change
Non-voting delegations
change
- American Samoa, 1978–present
- Cherokee Nation, 1835 & 2019–present (yet to be seated)
- Choctaw Nation, 1830 (never seated)
- District of Columbia, 1871–1875 & 1971–present
- Guam, 1970–present
- Northern Mariana Islands, 2009–present
- Philippines, 1907–1946 (obsolete since independence)
- Puerto Rico, 1901–present
- United States Virgin Islands, 1970–present
List of current districts by area
changeThis list includes the 435 current voting districts, along with the District of Columbia's non-voting delegation.[6]
| Rank small |
Rank large |
District | Land area (mi²) |
Land area (km²) |
|---|---|---|---|---|
| 435 | 1 | Alaska At-large | 571,951.26 | 1,481,353.76 |
| 434 | 2 | Montana At-large | 145,552.44 | 376,980.82 |
| 433 | 3 | Wyoming At-large | 97,100.40 | 251,490.04 |
| 432 | 4 | South Dakota At-large | 75,884.64 | 196,541.22 |
| 431 | 5 | New Mexico 2nd | 71,739.49 | 185,805.46 |
| 430 | 6 | Oregon 2nd | 69,442.78 | 179,856.98 |
| 429 | 7 | North Dakota At-large | 68,975.93 | 178,647.66 |
| 428 | 8 | Nebraska 3rd | 67,435.41 | 174,657.89 |
| 427 | 9 | Texas 23rd | 58,059.18 | 150,373.43 |
| 426 | 10 | Nevada 2nd | 55,829.71 | 144,599.09 |
| 425 | 11 | Arizona 1st | 55,039.61 | 142,552.73 |
| 424 | 12 | Kansas 1st | 52,542.5 | 136,085.21 |
| 423 | 13 | Nevada 4th | 50,997.97 | 132,084.87 |
| 422 | 14 | Colorado 3rd | 49,731.77 | 128,805.41 |
| 421 | 15 | New Mexico 3rd | 44,958.52 | 116,442.68 |
| 420 | 16 | Idaho 2nd | 43,225.09 | 111,953.1 |
| 419 | 17 | Utah 2nd | 39,987.95 | 103,568.89 |
| 418 | 18 | Idaho 1st | 39,418.02 | 102,092.77 |
| 417 | 19 | Texas 13th | 38,349.24 | 99,324.63 |
| 416 | 20 | Colorado 4th | 38,102.67 | 98,686.01 |
| 415 | 21 | Oklahoma 3rd | 34,116.73 | 88,362.42 |
| 414 | 22 | Minnesota 7th | 33,429.31 | 86,582 |
| 413 | 23 | Arizona 4th | 33,199.45 | 85,986.66 |
| 412 | 24 | California 8th | 32,867.21 | 85,126.16 |
| 411 | 25 | California 1st | 28,089.47 | 72,751.8 |
| 410 | 26 | Minnesota 8th | 27,908.13 | 72,282.13 |
| 409 | 27 | Texas 11th | 27,832.17 | 72,085.39 |
| 408 | 28 | Maine 2nd | 27,557.4 | 71,373.74 |
| 407 | 29 | Texas 19th | 25,835.59 | 66,914.25 |
| 406 | 30 | Michigan 1st | 25,027.75 | 64,821.94 |
| 405 | 31 | Wisconsin 7th | 23,037.26 | 59,666.56 |
| 404 | 32 | Iowa 4th | 22,756.75 | 58,940.04 |
| 403 | 33 | Arkansas 4th | 22,338.08 | 57,855.69 |
| 402 | 34 | Oklahoma 2nd | 20,995.35 | 54,378.01 |
| 401 | 35 | Utah 3rd | 20,070.54 | 51,982.75 |
| 400 | 36 | Missouri 8th | 19,901.17 | 51,544.08 |
| 399 | 37 | Utah 1st | 19,560.79 | 50,662.5 |
| 398 | 38 | Arkansas 1st | 19,318.29 | 50,034.42 |
| 397 | 39 | Washington 4th | 19,250.22 | 49,858.12 |
| 396 | 40 | Missouri 6th | 18,198.62 | 47,134.47 |
| 395 | 41 | Oregon 4th | 17,274.04 | 44739.81 |
| 394 | 42 | Arizona 3rd | 15,688.79 | 40,634.01 |
| 393 | 43 | Mississippi 2nd | 15,551.51 | 40,278.45 |
| 392 | 44 | Washington 5th | 15,473.13 | 40,075.45 |
| 391 | 45 | New York 21st | 15,114.76 | 39,147.27 |
| 390 | 46 | Illinois 15th | 14,695.67 | 38,061.82 |
| 389 | 47 | Louisiana 5th | 14,452.88 | 37,433 |
| 388 | 48 | Missouri 4th | 14,401.38 | 37,299.61 |
| 387 | 49 | Kansas 4th | 14,315.68 | 37,077.65 |
| 386 | 50 | Kansas 2nd | 14,143.34 | 36,631.29 |
| 385 | 51 | California 2nd | 12,952.23 | 33,546.31 |
| 384 | 52 | California 4th | 12,836.2 | 33,245.79 |
| 383 | 53 | Mississippi 3rd | 12,754.48 | 33,034.14 |
| 382 | 54 | Louisiana 4th | 12,435.1 | 32,206.94 |
| 381 | 55 | Iowa 2nd | 12,261.92 | 31,758.40 |
| 380 | 56 | Kentucky 1st | 12,079.5 | 31,285.94 |
| 379 | 57 | Iowa 1st | 12,048.84 | 31,206.53 |
| 378 | 58 | Minnesota 1st | 11,973.99 | 31,012.67 |
| 377 | 59 | Kentucky 5th | 11,235.15 | 29,099.07 |
| 376 | 60 | Wisconsin 3rd | 11,111.79 | 28,779.56 |
| 375 | 61 | Pennsylvania 5th | 10,711.21 | 27,742.06 |
| 374 | 62 | Mississippi 1st | 10,572.8 | 27,383.58 |
| 373 | 63 | Illinois 18th | 10,515.95 | 27,236.34 |
| 372 | 64 | Alabama 7th | 10,156.13 | 26,304.40 |
| 371 | 65 | Alabama 2nd | 10,141.63 | 26,266.85 |
| 370 | 66 | Texas 4th | 10,122.99 | 26,218.57 |
| 369 | 67 | Virginia 5th | 10,029.79 | 25,977.18 |
| 368 | 68 | California 23rd | 9,898 | 25,635.85 |
| 367 | 69 | Oklahoma 4th | 9,777.28 | 25,323.18 |
| 366 | 70 | West Virginia 3rd | 9,745.33 | 25,240.43 |
| 365 | 71 | Georgia 2nd | 9,626.23 | 24,931.96 |
| 364 | 72 | Texas 28th | 9,378.53 | 24,290.42 |
| 363 | 73 | Vermont At-large | 9,249.56 | 23,956.36 |
| 362 | 74 | Tennessee 7th | 9,160.44 | 23,725.56 |
| 361 | 75 | Texas 27th | 9,128.25 | 23,642.19 |
| 360 | 76 | Washington 3rd | 9,114.01 | 23,605.31 |
| 359 | 77 | Virginia 9th | 9,113.87 | 23,604.95 |
| 358 | 78 | Alabama 4th | 8,888.77 | 23,021.94 |
| 357 | 79 | Nebraska 1st | 8,879.02 | 22,996.68 |
| 356 | 80 | Iowa 3rd | 8,789.62 | 22,765.14 |
| 355 | 81 | Georgia 8th | 8,711.64 | 22,563.17 |
| 354 | 82 | Florida 2nd | 8,613.58 | 22,309.19 |
| 353 | 83 | Michigan 4th | 8,457.8 | 21,905.72 |
| 352 | 84 | Pennsylvania 10th | 8,378.06 | 21,699.2 |
| 351 | 85 | Texas 34th | 8,190.32 | 21,212.95 |
| 350 | 86 | Georgia 12th | 8,185.27 | 21,199.87 |
| 349 | 87 | South Carolina 6th | 8,062.93 | 20,883.01 |
| 348 | 88 | Mississippi 4th | 8,044.48 | 20,835.22 |
| 347 | 89 | West Virginia 2nd | 8,017.31 | 20,764.85 |
| 346 | 90 | Georgia 1st | 7,982.81 | 20,675.5 |
| 345 | 91 | New York 19th | 7,937.02 | 20,556.90 |
| 344 | 92 | Illinois 16th | 7,917.49 | 20,506.32 |
| 343 | 93 | Texas 1st | 7,858.86 | 20,354.47 |
| 342 | 94 | Arizona 2nd | 7,838.12 | 20,300.75 |
| 341 | 95 | North Carolina 3rd | 7,810.08 | 20,228.13 |
| 340 | 96 | Texas 15th | 7,804.07 | 20,212.56 |
| 339 | 97 | Texas 17th | 7,651.16 | 19,816.52 |
| 338 | 98 | Texas 25th | 7,620.7 | 19,737.63 |
| 337 | 99 | Alabama 3rd | 7,543.86 | 19,538.62 |
| 336 | 100 | Colorado 2nd | 7,535.34 | 19,516.55 |
| 335 | 101 | New York 23rd | 7,371.65 | 19,092.59 |
| 334 | 102 | Washington 8th | 7,359.7 | 19,061.64 |
| 333 | 103 | Florida 3rd | 7,306.05 | 18,922.69 |
| 332 | 104 | Colorado 5th | 7,265.72 | 18,818.23 |
| 331 | 105 | Indiana 8th | 7,255.39 | 18,791.48 |
| 330 | 106 | Ohio 6th | 7,215.03 | 18,686.95 |
| 329 | 107 | Kentucky 2nd | 7,177.44 | 18,589.59 |
| 328 | 108 | Texas 36th | 7,125.83 | 18,455.92 |
| 327 | 109 | Georgia 10th | 7,096.22 | 18,379.23 |
| 326 | 110 | Louisiana 3rd | 6,983.32 | 18,086.82 |
| 325 | 111 | Illinois 17th | 6,933.08 | 17,956.7 |
| 324 | 112 | Washington 6th | 6,902.73 | 17,878.09 |
| 323 | 113 | California 24th | 6,883.35 | 17,827.89 |
| 322 | 114 | Missouri 3rd | 6,851.54 | 17,745.51 |
| 321 | 115 | Tennessee 8th | 6,850.53 | 17,742.89 |
| 320 | 116 | North Carolina 11th | 6,838.24 | 17,711.06 |
| 319 | 117 | Wisconsin 8th | 6,806.67 | 17,629.29 |
| 318 | 118 | California 21st | 6,729.94 | 17,430.56 |
| 317 | 119 | New Hampshire 2nd | 6,489 | 16,806.53 |
| 316 | 120 | Tennessee 6th | 6,474.21 | 16,768.22 |
| 315 | 121 | Florida 17th | 6,369.97 | 16,498.24 |
| 314 | 122 | Indiana 4th | 6,352.55 | 16,453.12 |
| 313 | 123 | West Virginia 1st | 6,275.56 | 16,253.72 |
| 312 | 124 | Missouri 7th | 6,272.84 | 16,246.67 |
| 311 | 125 | Hawaii 2nd | 6,213.4 | 16,092.72 |
| 310 | 126 | Indiana 6th | 6,206.83 | 16,075.71 |
| 309 | 127 | Washington 1st | 6,186.47 | 16,022.97 |
| 308 | 128 | California 3rd | 6,183.59 | 16,015.51 |
| 307 | 129 | North Carolina 7th | 6,161.77 | 15,959 |
| 306 | 130 | Alabama 1st | 6,066.83 | 15,713.11 |
| 305 | 131 | Texas 8th | 6,053.76 | 15,679.25 |
| 304 | 132 | Tennessee 4th | 5,984.84 | 15,500.75 |
| 303 | 133 | Virginia 6th | 5,930.02 | 15,358.77 |
| 302 | 134 | Texas 21st | 5,920.89 | 15,335.12 |
| 301 | 135 | California 36th | 5,912.64 | 15,313.75 |
| 300 | 136 | Illinois 13th | 5,793.65 | 15,005.57 |
| 299 | 137 | Pennsylvania 9th | 5,730.09 | 14,840.95 |
| 298 | 138 | Ohio 5th | 5,626.47 | 14,572.57 |
| 297 | 139 | South Carolina 5th | 5,505.54 | 14,259.36 |
| 296 | 140 | North Carolina 1st | 5,494.28 | 14,230.2 |
| 295 | 141 | Arkansas 3rd | 5,400.99 | 13,988.58 |
| 294 | 142 | South Carolina 7th | 5,354.62 | 13,868.48 |
| 293 | 143 | South Carolina 3rd | 5,268.28 | 13,644.86 |
| 292 | 144 | Georgia 9th | 5,210.81 | 13,496.01 |
| 291 | 145 | Oregon 5th | 5,189.73 | 13,441.41 |
| 290 | 146 | New York 22nd | 5,077.45 | 13,150.61 |
| 289 | 147 | Texas 10th | 5,070.95 | 13,133.77 |
| 288 | 148 | Texas 5th | 5,043.85 | 13,063.58 |
| 287 | 149 | Illinois 12th | 5,008.21 | 12,971.28 |
| 286 | 150 | Arkansas 2nd | 4,978.12 | 12,893.34 |
| 285 | 151 | Wisconsin 6th | 4,918.39 | 12,738.64 |
| 284 | 152 | California 20th | 4,874.22 | 12,624.24 |
| 283 | 153 | California 51st | 4,791.61 | 12,410.28 |
| 282 | 154 | Ohio 15th | 4,738.93 | 12,273.84 |
| 281 | 155 | Ohio 4th | 4,664.87 | 12,082.03 |
| 280 | 156 | New Mexico 1st | 4,600.14 | 11,914.37 |
| 279 | 157 | Tennessee 3rd | 4,570.32 | 11,837.14 |
| 278 | 158 | Wisconsin 2nd | 4,536.69 | 11,750.04 |
| 277 | 159 | North Carolina 8th | 4,512.78 | 11,688.11 |
| 276 | 160 | Indiana 9th | 4,486.77 | 11,620.75 |
| 275 | 161 | Kentucky 4th | 4,382.19 | 11,349.88 |
| 274 | 162 | Virginia 4th | 4,310.34 | 11,163.79 |
| 273 | 163 | Kentucky 6th | 4,292.72 | 11,118.16 |
| 272 | 164 | Michigan 7th | 4,227.73 | 10,949.83 |
| 271 | 165 | Indiana 3rd | 4,180.37 | 10,827.17 |
| 270 | 166 | Alabama 6th | 4,170.78 | 10,802.331 |
| 269 | 167 | Tennessee 1st | 4,141.92 | 10,727.58 |
| 268 | 168 | Michigan 10th | 4,140.44 | 10,723.75 |
| 267 | 169 | Louisiana 6th | 4,033.89 | 10,447.79 |
| 266 | 170 | Louisiana 1st | 4,030.23 | 10,438.31 |
| 265 | 171 | Florida 1st | 4,016.3 | 10,402.23 |
| 264 | 172 | Maryland 1st | 3,977.06 | 10,300.6 |
| 263 | 173 | New York 27th | 3,973.13 | 10,290.42 |
| 262 | 174 | Indiana 2nd | 3,958.58 | 10,252.73 |
| 261 | 175 | Ohio 7th | 3,864.76 | 10,009.74 |
| 260 | 176 | Pennsylvania 3rd | 3,850.8 | 9,973.58 |
| 259 | 177 | Georgia 3rd | 3,838.27 | 9,941.13 |
| 258 | 178 | Virginia 1st | 3,684.32 | 9,542.4 |
| 257 | 179 | Alabama 5th | 3,677.31 | 9,524.24 |
| 256 | 180 | North Carolina 6th | 3,674.55 | 9517.09 |
| 255 | 181 | Georgia 14th | 3,623.16 | 9,383.99 |
| 254 | 182 | North Carolina 5th | 3,571.86 | 9,251.13 |
| 253 | 183 | Michigan 6th | 3,546.74 | 9,186.07 |
| 252 | 184 | Pennsylvania 11th | 3,356.48 | 8,693.29 |
| 251 | 185 | Maine 1st | 3,285.52 | 8,509.51 |
| 250 | 186 | Michigan 2nd | 3,281.19 | 8,498.29 |
| 249 | 187 | North Carolina 2nd | 3,246.68 | 8,408.91 |
| 248 | 188 | Florida 25th | 3,232.71 | 8,372.73 |
| 247 | 189 | Ohio 2nd | 3,221.62 | 8,344 |
| 246 | 190 | South Carolina 2nd | 3,022.17 | 7,827.43 |
| 245 | 191 | Oregon 1st | 3,007 | 7,788.14 |
| 244 | 192 | Minnesota 6th | 2,882.22 | 7,464.96 |
| 243 | 193 | Nevada 3rd | 2,848.99 | 7,378.89 |
| 242 | 194 | California 16th | 2,839.51 | 7,354.34 |
| 241 | 195 | California 50th | 2,787.35 | 7,219.24 |
| 240 | 196 | Virginia 7th | 2,776.39 | 7,190.86 |
| 239 | 197 | Michigan 3rd | 2,628.74 | 6,808.44 |
| 238 | 198 | North Carolina 10th | 2,575.16 | 6,669.67 |
| 237 | 199 | Utah 4th | 2,550.35 | 6,605.41 |
| 236 | 200 | Florida 11th | 2,509.88 | 6,500.6 |
| 235 | 201 | Florida 6th | 2,506.92 | 6,492.93 |
| 234 | 202 | New Hampshire 1st | 2,463.65 | 6,380.86 |
| 233 | 203 | Ohio 8th | 2,450.49 | 6,346.78 |
| 232 | 204 | Texas 14th | 2,441.39 | 6,323.21 |
| 231 | 205 | Minnesota 2nd | 2,437.91 | 6,314.19 |
| 230 | 206 | Florida 20th | 2,427.42 | 6,287.02 |
| 229 | 207 | Missouri 5th | 2,424.85 | 6,280.37 |
| 228 | 208 | New York 24th | 2,388.56 | 6,186.38 |
| 227 | 209 | Massachusetts 1st | 2,350.29 | 6,087.26 |
| 226 | 210 | Michigan 5th | 2,348.70 | 6,083.14 |
| 225 | 211 | Tennessee 2nd | 2,320.68 | 6,010.57 |
| 224 | 212 | North Carolina 13th | 2,280.59 | 5,906.73 |
| 223 | 213 | Ohio 12th | 2,271.91 | 5,884.25 |
| 222 | 214 | Pennsylvania 12th | 2,163.03 | 5,602.25 |
| 221 | 215 | Texas 31st | 2,154.49 | 5,580.13 |
| 220 | 216 | Texas 6th | 2,148.41 | 5,564.39 |
| 219 | 217 | Florida 26th | 2,098.66 | 5,435.53 |
| 218 | 218 | New Jersey 2nd | 2,092.43 | 5,419.40 |
| 217 | 219 | Oklahoma 5th | 2,073.90 | 5,371.41 |
| 216 | 220 | Pennsylvania 18th | 2,072.79 | 5,368.53 |
| 215 | 221 | Connecticut 2nd | 1,987.68 | 5,148.10 |
| 214 | 222 | Ohio 14th | 1,953.14 | 5,058.64 |
| 213 | 223 | Maryland 6th | 1,950.26 | 5,051.18 |
| 212 | 224 | Delaware At-large | 1,949.00 | 5,047.00 |
| 211 | 225 | Indiana 5th | 1,924.76 | 4,985.13 |
| 210 | 226 | Wisconsin 5th | 1,890.75 | 4,897.05 |
| 209 | 227 | Florida 4th | 1,875.97 | 4,858.77 |
| 208 | 228 | California 10th | 1,818.79 | 4,710.67 |
| 207 | 229 | Florida 8th | 1,752.06 | 4,537.84 |
| 206 | 230 | Pennsylvania 17th | 1,733.22 | 4,489.04 |
| 205 | 231 | California 5th | 1,730.82 | 4,482.83 |
| 204 | 232 | Wisconsin 1st | 1,727.92 | 4,475.32 |
| 203 | 233 | Florida 9th | 1,707.49 | 4,422.40 |
| 202 | 234 | California 25th | 1,690.50 | 4,378.40 |
| 201 | 235 | Oklahoma 1st | 1,631.67 | 4,226.03 |
| 200 | 236 | Massachusetts 2nd | 1,628.00 | 4,216.52 |
| 199 | 237 | Illinois 14th | 1,597.60 | 4,137.79 |
| 198 | 238 | South Carolina 1st | 1,547.86 | 4,008.96 |
| 197 | 239 | Pennsylvania 4th | 1,517.84 | 3,931.21 |
| 196 | 240 | Florida 18th | 1,512.55 | 3,917.51 |
| 195 | 241 | Michigan 8th | 1,503.18 | 3,893.24 |
| 194 | 242 | Maryland 5th | 1,481.24 | 3,836.42 |
| 193 | 243 | Texas 12th | 1,441.16 | 3,732.61 |
| 192 | 244 | Virginia 10th | 1,372.24 | 3,554.11 |
| 191 | 245 | Florida 5th | 1,355.03 | 3,509.53 |
| 190 | 246 | New York 18th | 1,353.42 | 3,505.36 |
| 189 | 247 | South Carolina 4th | 1,299.30 | 3,365.19 |
| 188 | 248 | Pennsylvania 15th | 1,285.03 | 3,328.23 |
| 187 | 249 | Louisiana 2nd | 1,268.48 | 3,285.37 |
| 186 | 250 | Tennessee 5th | 1,248.57 | 3,233.80 |
| 185 | 251 | Connecticut 5th | 1,248.16 | 3,232.74 |
| 184 | 252 | California 9th | 1,245.28 | 3,225.28 |
| 183 | 253 | New York 20th | 1,231.28 | 3,189.02 |
| 182 | 254 | Massachusetts 9th | 1,214.74 | 3,146.18 |
| 181 | 255 | Ohio 16th | 1,205.34 | 3,121.83 |
| 180 | 256 | California 22nd | 1,165.12 | 3,017.66 |
| 179 | 257 | Indiana 1st | 1,157.02 | 2,996.68 |
| 178 | 258 | Ohio 10th | 1,129.76 | 2,926.08 |
| 177 | 259 | Florida 10th | 1,129.32 | 2,924.94 |
| 176 | 260 | Illinois 2nd | 1,080.67 | 2,798.94 |
| 175 | 261 | Oregon 3rd | 1,074.46 | 2,782.85 |
| 174 | 262 | Georgia 11th | 1,071.25 | 2,774.54 |
| 173 | 263 | North Carolina 4th | 1,045.35 | 2,707.46 |
| 172 | 264 | Texas 22nd | 1,032.84 | 2,675.06 |
| 171 | 265 | Washington 2nd | 1,015.02 | 2,628.90 |
| 170 | 266 | Pennsylvania 16th | 997.68 | 2,583.99 |
| 169 | 267 | Virginia 2nd | 991.68 | 2,568.45 |
| 168 | 268 | New Jersey 5th | 991.30 | 2,567.47 |
| 167 | 269 | New Jersey 7th | 970.19 | 2,512.79 |
| 166 | 270 | Virginia 3rd | 947.10 | 2,452.99 |
| 165 | 271 | California 26th | 939.12 | 2,432.32 |
| 164 | 272 | California 42nd | 935.96 | 2,424.14 |
| 163 | 273 | California 19th | 915.34 | 2,370.73 |
| 162 | 274 | Texas 26th | 907.15 | 2,349.52 |
| 161 | 275 | New Jersey 3rd | 899.70 | 2,330.23 |
| 160 | 276 | Ohio 13th | 894.30 | 2,316.24 |
| 159 | 277 | Florida 12th | 883.75 | 2,288.91 |
| 158 | 278 | Florida 16th | 875.33 | 2,267.11 |
| 157 | 279 | Pennsylvania 7th | 862.56 | 2,234.03 |
| 156 | 280 | Pennsylvania 6th | 860.47 | 2,228.62 |
| 155 | 281 | Maryland 8th | 859.85 | 2,227.01 |
| 154 | 282 | North Carolina 9th | 856.93 | 2,219.45 |
| 153 | 283 | Washington 10th | 826.67 | 2,141.08 |
| 152 | 284 | Florida 15th | 818.51 | 2,119.94 |
| 151 | 285 | Rhode Island 2nd | 765.32 | 1,982.18 |
| 150 | 286 | Massachusetts 3rd | 757.86 | 1,962.86 |
| 149 | 287 | Kansas 3rd | 757.20 | 1,961.15 |
| 148 | 288 | Florida 19th | 750.37 | 1,943.46 |
| 147 | 289 | Georgia 13th | 714.95 | 1,851.72 |
| 146 | 290 | Texas 16th | 710.35 | 1,839.81 |
| 145 | 291 | Pennsylvania 8th | 706.93 | 1,830.95 |
| 144 | 292 | California 27th | 699.90 | 1,812.74 |
| 143 | 293 | California 18th | 696.12 | 1,802.95 |
| 142 | 294 | New Jersey 4th | 691.88 | 1,791.97 |
| 141 | 295 | Ohio 1st | 686.96 | 1,779.23 |
| 140 | 296 | Connecticut 1st | 675.45 | 1,749.42 |
| 139 | 297 | Massachusetts 4th | 668.27 | 1,730.82 |
| 138 | 298 | New York 1st | 650.02 | 1,683.55 |
| 137 | 299 | Arizona 6th | 625.07 | 1,618.93 |
| 136 | 300 | California 15th | 599.45 | 1,552.58 |
| 135 | 301 | Texas 35th | 593.77 | 1,537.87 |
| 134 | 302 | California 49th | 553.08 | 1,432.48 |
| 115 | 321 | North Carolina 12th | 441 | 1,143.4 |
| 132 | 304 | California 7th | 548.65 | 1,421.00 |
| 131 | 305 | Arizona 8th | 539.66 | 1,397.72 |
| 130 | 306 | Minnesota 3rd | 527.05 | 1,365.06 |
| 129 | 307 | Massachusetts 6th | 526.79 | 1,364.39 |
| 128 | 308 | Florida 7th | 513.58 | 1,330.17 |
| 127 | 309 | New York 25th | 510.19 | 1,321.39 |
| 126 | 310 | Nebraska 2nd | 509.74 | 1,320.23 |
| 125 | 311 | New Jersey 11th | 504.97 | 1,307.87 |
| 124 | 312 | Georgia 4th | 496.6 | 1,286.20 |
| 123 | 313 | California 11th | 493.61 | 1,278.45 |
| 122 | 314 | Maryland 7th | 488.03 | 1,264.00 |
| 121 | 315 | Tennessee 9th | 483.39 | 1,251.98 |
| 120 | 316 | Texas 3rd | 480.88 | 1,245.48 |
| 119 | 317 | Colorado 6th | 474.66 | 1,229.37 |
| 118 | 318 | Connecticut 3rd | 470.34 | 1,218.18 |
| 117 | 319 | Missouri 2nd | 465.76 | 1,206.32 |
| 116 | 320 | Ohio 9th | 464.65 | 1,203.44 |
| 115 | 321 | Connecticut 4th | 460.73 | 1,193.29 |
| 114 | 322 | Michigan 11th | 419.26 | 1,085.88 |
| 113 | 323 | New Jersey 12th | 412.23 | 1,067.68 |
| 112 | 324 | Michigan 12th | 403.21 | 1,044.31 |
| 111 | 325 | Georgia 7th | 392.61 | 1,016.86 |
| 110 | 326 | New York 17th | 382.63 | 991.01 |
| 109 | 327 | Illinois 6th | 378.78 | 981.04 |
| 108 | 328 | Texas 30th | 356.27 | 922.74 |
| 107 | 329 | New Jersey 1st | 350.02 | 906.55 |
| 106 | 330 | Maryland 2nd | 348.88 | 903.6 |
| 105 | 331 | Colorado 7th | 342.11 | 886.07 |
| 104 | 332 | Minnesota 4th | 332.49 | 861.15 |
| 103 | 333 | California 45th | 330.39 | 855.71 |
| 102 | 334 | Massachusetts 8th | 326.37 | 845.3 |
| 101 | 335 | Kentucky 3rd | 319.34 | 827.09 |
| 100 | 336 | California 41st | 316.54 | 819.84 |
| 99 | 337 | Texas 2nd | 308.75 | 799.66 |
| 98 | 338 | Maryland 3rd | 304.14 | 787.72 |
| 97 | 339 | Indiana 7th | 303.84 | 786.95 |
| 96 | 340 | Illinois 10th | 299.78 | 776.43 |
| 95 | 341 | Georgia 6th | 298.76 | 773.79 |
| 94 | 342 | Maryland 4th | 297.81 | 771.33 |
| 93 | 343 | Arizona 5th | 293.47 | 760.09 |
| 92 | 344 | California 33rd | 288.58 | 747.42 |
| 91 | 345 | Illinois 11th | 280.95 | 727.66 |
| 90 | 346 | Rhode Island 1st | 268.49 | 695.39 |
| 89 | 347 | California 52nd | 267 | 691.53 |
| 88 | 348 | Florida 14th | 265.4 | 687.39 |
| 87 | 349 | Massachusetts 5th | 265.08 | 686.56 |
| 86 | 350 | Georgia 5th | 264.91 | 686.12 |
| 85 | 351 | Texas 24th | 262.76 | 680.55 |
| 84 | 352 | Florida 21st | 260.97 | 675.91 |
| 83 | 353 | California 14th | 259.5 | 672.11 |
| 82 | 354 | Illinois 1st | 258.38 | 669.2 |
| 81 | 355 | New York 3rd | 254.92 | 660.24 |
| 80 | 356 | Ohio 11th | 244.46 | 633.15 |
| 79 | 357 | Illinois 3rd | 237.18 | 614.3 |
| 78 | 358 | Texas 18th | 235.2 | 609.17 |
| 77 | 359 | Ohio 3rd | 228 | 590.52 |
| 76 | 360 | Missouri 1st | 225.36 | 583.68 |
| 75 | 361 | New York 26th | 219.13 | 567.55 |
| 74 | 362 | California 28th | 218.45 | 565.79 |
| 73 | 363 | California 31st | 218.24 | 565.24 |
| 72 | 364 | California 47th | 216.21 | 559.98 |
| 71 | 365 | New Jersey 6th | 215.55 | 558.28 |
| 70 | 366 | Texas 33rd | 211.94 | 548.93 |
| 69 | 367 | Pennsylvania 14th | 209.29 | 542.06 |
| 68 | 368 | Hawaii 1st | 209.22 | 541.88 |
| 67 | 369 | Florida 27th | 208.84 | 540.9 |
| 66 | 370 | Illinois 8th | 205.52 | 532.3 |
| 65 | 371 | Arizona 7th | 205.12 | 531.26 |
| 64 | 372 | California 39th | 204.4 | 529.4 |
| 63 | 373 | Texas 20th | 199.68 | 517.17 |
| 62 | 374 | Colorado 1st | 189.62 | 491.12 |
| 61 | 375 | Texas 29th | 187.07 | 484.51 |
| 60 | 376 | Florida 13th | 186.03 | 481.82 |
| 59 | 377 | Michigan 14th | 185.73 | 481.04 |
| 58 | 378 | Texas 32nd | 185.66 | 480.86 |
| 57 | 379 | Virginia 11th | 185.09 | 479.38 |
| 56 | 380 | California 17th | 184.85 | 478.76 |
| 55 | 381 | Michigan 13th | 184.85 | 478.76 |
| 54 | 382 | Michigan 9th | 183.59 | 475.5 |
| 53 | 383 | Washington 9th | 183.43 | 475.08 |
| 52 | 384 | New York 2nd | 182.01 | 471.41 |
| 51 | 385 | California 6th | 175.04 | 453.35 |
| 50 | 386 | Florida 22nd | 172.88 | 447.76 |
| 49 | 387 | Florida 23rd | 169.1 | 437.97 |
| 48 | 388 | California 35th | 168.88 | 437.4 |
| 47 | 389 | Texas 9th | 165.64 | 429.01 |
| 46 | 390 | Arizona 9th | 164.79 | 426.81 |
| 45 | 391 | Texas 7th | 161.94 | 419.43 |
| 44 | 392 | Pennsylvania 13th | 155.18 | 401.92 |
| 43 | 393 | Virginia 8th | 149.24 | 386.53 |
| 42 | 394 | California 48th | 145.47 | 376.77 |
| 41 | 395 | Washington 7th | 144.13 | 373.3 |
| 40 | 396 | California 30th | 135.94 | 352.08 |
| 39 | 397 | Minnesota 5th | 135.66 | 351.36 |
| 38 | 398 | California 53rd | 135.43 | 350.76 |
| 37 | 399 | Wisconsin 4th | 128.35 | 332.43 |
| 36 | 400 | California 32nd | 124.23 | 321.76 |
| 35 | 401 | New York 4th | 110.85 | 287.1 |
| 34 | 402 | Florida 24th | 106.08 | 274.75 |
| 33 | 403 | Illinois 9th | 91.85 | 237.89 |
| 32 | 404 | Nevada 1st | 104.5 | 270.66 |
| 31 | 405 | California 38th | 101.46 | 262.78 |
| 30 | 406 | California 13th | 96.79 | 250.69 |
| 29 | 407 | Illinois 5th | 95.71 | 247.89 |
| 28 | 408 | New Jersey 9th | 95.34 | 246.93 |
| 27 | 409 | California 29th | 92.03 | 238.26 |
| 26 | 410 | California 44th | 79.36 | 205.46 |
| 25 | 411 | New York 16th | 78.37 | 202.98 |
| 24 | 412 | Pennsylvania 1st | 77.91 | 201.79 |
| 23 | 413 | New Jersey 10th | 75.92 | 196.63 |
| 22 | 414 | Pennsylvania 2nd | 74.14 | 192.02 |
| 21 | 415 | California 43rd | 72.03 | 186.56 |
| 20 | 416 | California 46th | 71.72 | 185.75 |
| 19 | 417 | New York 11th | 65.83 | 170.5 |
| 18 | 418 | Massachusetts 7th | 62.67 | 162.32 |
| 17 | 419 | Illinois 7th | 62.52 | 161.93 |
| — | — | District of Columbia At-large | 61.40 | 159.03 |
| 16 | 420 | California 40th | 57.69 | 149.42 |
| 15 | 421 | California 37th | 55.26 | 143.12 |
| 14 | 422 | New Jersey 8th | 54.69 | 141.65 |
| 13 | 423 | Illinois 4th | 52.45 | 135.85 |
| 12 | 424 | New York 5th | 51.88 | 134.37 |
| 11 | 425 | California 34th | 47.66 | 123.44 |
| 10 | 426 | California 12th | 38.97 | 100.93 |
| 9 | 427 | New York 6th | 29.78 | 77.13 |
| 8 | 428 | New York 8th | 29.66 | 76.82 |
| 7 | 429 | New York 14th | 28.29 | 73.27 |
| 6 | 430 | New York 7th | 16.16 | 41.85 |
| 5 | 431 | New York 9th | 15.54 | 40.25 |
| 4 | 432 | New York 12th | 14.79 | 38.31 |
| 3 | 433 | New York 15th | 14.54 | 37.66 |
| 2 | 434 | New York 10th | 14.25 | 36.91 |
| 1 | 435 | New York 13th | 10.25 | 26.55 |
Related pages
change- List of Members of the U.S. House of Representatives
- Apportionment
- General ticket
- Redistricting
- Representation
- United States Census Bureau
- Better Know A District: A recurring segment on The Colbert Report, in which Stephen Colbert profiled a congressional district and interviewed its Representative. Described by Colbert as a "435-part series".
Comparisons
changeNotes
change- ↑ 1.0 1.1 1.2 1.3 Maine used to be part of Massachusetts. After the 1810 census, Massachusetts was allocated 20 districts. Seven districts (numbers 14 through 20) were credited to Maine soon after it became a state in 1820.
References
change- ↑ 1.0 1.1 1.2 1.3 1.4 "2020 Census Apportionment Results Delivered to the President". US Census Bureau. April 26, 2021. Retrieved October 3, 2017.
- ↑ Public Law 62-5 of 1911, though Congress has the power to change that number.
- ↑ "GreatData.com". Archived from the original on May 30, 2013. Retrieved June 12, 2013.
- ↑ "Rhode Island's 1st congressional district". United States Census Bureau. Retrieved February 25, 2023.
- ↑ Sarah Burd-Sharps and Kristen Lewis. Geographies of Opportunity: Ranking Well-Being by Congressional District. Archived 2018-01-02 at the Wayback Machine Social Science Research Council, Measure of America. 2015.
- ↑ Geography, US Census Bureau. "Congressional Districts Relationship Files (state-based)". www.census.gov. Archived from the original on July 17, 2017. Retrieved May 8, 2018.
- "United States Census 2010". U.S. Census Bureau. Retrieved October 25, 2013.
- Martis, Kenneth C. (1989). The Historical Atlas of Political Parties in the United States Congress, 1789–1989. Macmillan Publishing. ISBN 978-0-02-920170-1.
Other websites
change- Find a Senator or Representative via Govtrack.us
- United States Census Bureau:
- "National Atlas Printable District Maps". Archived from the original on February 22, 2014.
- Jeffrey B. Lewis; et al. (2013). "Digital Boundary Definitions of United States Congressional Districts, 1789–2012". University of California, Los Angeles.