| Presidential election
|
| Choice
|
Votes
|
%
|
| Hillary Clinton
|
8,753,788
|
61.73%
|
| Donald Trump
|
4,483,810
|
31.62%
|
| Gary Johnson
|
478,500
|
3.37%
|
| Jill Stein
|
278,657
|
1.96%
|
| Bernie Sanders (write-in)
|
79,341
|
0.56%
|
| Gloria La Riva
|
66,101
|
0.47%
|
| Evan McMullin (write-in)
|
39,596
|
0.28%
|
| Mike Maturen (write-in)
|
1,316
|
0.01%
|
| Laurence Kotikoff (write-in)
|
402
|
>0.01%
|
| Jerry White (write-in)
|
84
|
>0.01%
|
| Total votes
|
14,181,595
|
100%
|
The following are poll results from www.realclearpolitics.com[1][2] All polls showed that Democratic nominee Hillary Clinton had a big lead.
| Trump Vs. Clinton
|
| Date
|
Hillary Clinton
|
Donald Trump
|
|
Lead
|
| 2 Nov
|
54.3%
|
32.0%
|
+22.3%
|
| 26 Oct
|
53.3%
|
30.3%
|
+23.0%
|
| 14 Oct
|
52.0%
|
32.3%
|
+19.7%
|
| 30 May
|
48.7%
|
36.7%
|
+12.0%
|
| Trump Vs. Clinton Vs. Johnson Vs. Stein
|
| Date
|
Hillary Clinton
|
Donald Trump
|
Gary Johnson
|
Jill Stein
|
|
Lead
|
| 28 Oct to 31 Oct
|
56.0%
|
35.0%
|
4.0%
|
1.0%
|
+21.0%
|
| 25 Oct to 31 Oct
|
53.0%
|
33.0%
|
4.0%
|
3.0%
|
+20.0%
|
| 14 Oct to 23 Oct
|
54.0%
|
28.0%
|
5.0%
|
5.0%
|
+26.0%
|
| 27 Sep to 28 Sep
|
59.0%
|
33.0%
|
3.0%
|
2.0%
|
+26.0%
|
| 9 Sep to 18 Sep
|
47.0%
|
31.0%
|
10.0%
|
5.0%
|
+26.0%
|
| 7 Sep to 13 Sep
|
50.0%
|
33.0%
|
5.0%
|
6.0%
|
+17.0%
|
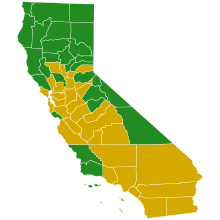 Primary results by county.
 Hillary Clinton
Bernie Sanders
| California Democratic primary, June 7, 2016
|
| Candidate
|
Popular vote
|
Estimated delegates
|
| Count
|
Percentage
|
Pledged
|
Unpledged
|
Total
|
| Hillary Clinton
|
2,745,302
|
53.07%
|
254
|
66
|
320
|
| Bernie Sanders
|
2,381,722
|
46.04%
|
221
|
0
|
221
|
| Willie Wilson
|
12,014
|
0.23%
|
|
|
|
| Michael Steinberg
|
10,880
|
0.21%
|
|
|
|
| Rocky De La Fuente
|
8,453
|
0.16%
|
|
|
|
| Henry Hewes
|
7,743
|
0.15%
|
|
|
|
| Keith Russell Judd
|
7,201
|
0.14%
|
|
|
|
| write-in
|
23
|
0.00%
|
|
|
|
| Uncommitted
|
—
|
|
10
|
10
|
| Total
|
5,173,338
|
100%
|
475
|
76
|
551
|
| Source: The Green Papers
|
Again, yellow is a victory for Clinton while green is a victory for Sanders.
| County [3]
|
Clinton
|
Votes
|
Sanders
|
Votes
|
| Alameda |
51.5% |
164,889 |
48.0% |
153,955
|
| Alpine |
44.8% |
113 |
54.4% |
137
|
| Amador |
50.4% |
2,516 |
47.8% |
2,386
|
| Butte |
37.0% |
11,766 |
62.0% |
19,739
|
| Calaveras |
49.5% |
2,971 |
48.5% |
2,914
|
| Colusa |
49.3% |
835 |
47.8% |
809
|
| Contra Costa |
56.7% |
103,333 |
42.7% |
77,862
|
| Del Norte |
40.4% |
1,119 |
57.6% |
1,598
|
| El Dorado |
49.1% |
12,492 |
49.6% |
12,620
|
| Fresno |
56.0% |
45,436 |
42.7% |
34,663
|
| Glenn |
46.8% |
911 |
51.5% |
1,003
|
| Humboldt |
28.7% |
8,135 |
70.4% |
19,928
|
| Imperial |
65.0% |
9,843 |
33.7% |
5,111
|
| Inyo |
42.5% |
1,001 |
55.7% |
1,313
|
| Kern |
54.1% |
28,806 |
43.9% |
23,374
|
| Kings |
57.8% |
4,150 |
39.9% |
2,869
|
| Lake |
42.7% |
3,988 |
55.7% |
5,195
|
| Lassen |
42.6% |
812 |
53.7% |
1,023
|
| Los Angeles |
54.4% |
780,013 |
44.6% |
639,886
|
| Madera |
53.1% |
5,808 |
44.4% |
4,852
|
| Marin |
56.4% |
43,283 |
43.3% |
33,214
|
| Mariposa |
44.1% |
1,102 |
54.2% |
1,355
|
| Mendocino |
32.8% |
6,048 |
66.5% |
12,259
|
| Merced |
53.0% |
10,839 |
45.3% |
9,273
|
| Modoc |
42.3% |
281 |
52.5% |
349
|
| Mono |
43.3% |
799 |
56.2% |
1,038
|
| Monterey |
52.8% |
29,730 |
46.3% |
26,073
|
| Napa |
53.4% |
13,583 |
45.9% |
11,682
|
| Nevada |
36.9% |
8,175 |
62.4% |
13,827
|
| Orange |
51.9% |
171,593 |
47.3% |
156,235
|
| Placer |
54.1% |
25,249 |
44.8% |
20,916
|
| Plumas |
44.1% |
1,211 |
53.7% |
1,475
|
| Riverside |
56.1% |
112,526 |
42.8% |
85,918
|
| Sacramento |
54.6% |
109,898 |
44.4% |
89,428
|
| San Benito |
54.3% |
4,112 |
44.6% |
3,380
|
| San Bernardino |
54.6% |
96,076 |
44.2% |
77,706
|
| San Diego |
51.6% |
215,655 |
47.7% |
199,716
|
| San Francisco |
53.6% |
116,359 |
45.9% |
99,594
|
| San Joaquin |
56.5% |
38,212 |
42.2% |
28,523
|
| San Luis Obispo |
46.7% |
21,637 |
52.6% |
24,379
|
| San Mateo |
58.7% |
79,756 |
40.8% |
55,367
|
| Santa Barbara |
46.9% |
31,927 |
52.4% |
35,717
|
| Santa Clara |
57.5% |
159,480 |
41.9% |
116,193
|
| Santa Cruz |
40.5% |
29,520 |
59.0% |
42,940
|
| Shasta |
45.4% |
7,809 |
52.4% |
9,026
|
| Sierra |
42.5% |
224 |
56.4% |
297
|
| Siskiyou |
38.0% |
2,466 |
60.0% |
3,894
|
| Solano |
55.3% |
34,231 |
43.8% |
27,122
|
| Sonoma |
47.3% |
55,595 |
52.0% |
61,167
|
| Stanislaus |
51.2% |
24,359 |
47.1% |
22,384
|
| Sutter |
52.7% |
4,023 |
45.4% |
3,463
|
| Tehama |
45.9% |
2,372 |
51.4% |
2,655
|
| Trinity |
35.1% |
672 |
63.3% |
1,211
|
| Tulare |
54.4% |
13,472 |
43.7% |
10,834
|
| Tuolumne |
48.2% |
3,433 |
50.5% |
3,592
|
| Ventura |
51.2% |
60,615 |
47.9% |
56,751
|
| Yolo |
48.2% |
17,655 |
51.3% |
18,761
|
| Yuba |
45.1% |
2,388 |
52.4% |
2,771
|
| Total |
53.1% |
2,745,302 |
46.0% |
2,381,722
|
 Republican primary results by county.
 Donald Trump
| California Republican primary, June 7, 2016
|
| Candidate
|
Votes
|
Percentage
|
Actual delegate count
|
| Bound
|
Unbound
|
Total
|
| Donald Trump
|
1,665,135
|
74.76%
|
172
|
0
|
172
|
| John Kasich (withdrawn)
|
252,544
|
11.34%
|
0
|
0
|
0
|
| Ted Cruz (withdrawn)
|
211,576
|
9.50%
|
0
|
0
|
0
|
| Ben Carson (withdrawn)
|
82,259
|
3.69%
|
0
|
0
|
0
|
| Jim Gilmore (withdrawn)
|
15,691
|
0.70%
|
0
|
0
|
0
|
| Write-ins
|
101
|
0.00%
|
0
|
0
|
0
|
| Unprojected delegates:
|
0
|
0
|
0
|
| Total:
|
2,227,306
|
100.00%
|
172
|
0
|
172
|
| Source: The Green Papers
|
| California Libertarian presidential primary, June 7, 2016[4]
|
| Candidate
|
Votes
|
Percentage
|
| Gary Johnson
|
19,294
|
62%
|
| John McAfee
|
3,139
|
10%
|
| Austin Petersen
|
1,853
|
6%
|
| Rhett Smith
|
1,531
|
5%
|
| Joy Waymire
|
923
|
3%
|
| John David Hale
|
873
|
3%
|
| Marc Allan Feldman
|
867
|
3%
|
| Jack Robinson, Jr.
|
739
|
2%
|
| Steve Kerbel
|
556
|
2%
|
| Darryl Perry
|
521
|
2%
|
| Derrick Michael Reid
|
462
|
1%
|
| Cecil Ince
|
417
|
1%
|
| Total
|
31,175
|
100%
|
| Green Party of California presidential primary, June 7, 2016[5]
|
| Candidate
|
Votes
|
Percentage
|
National delegates
|
| Jill Stein
|
10,134
|
76.4%
|
-
|
| Darryl Cherney
|
1,288
|
9.7%
|
-
|
| Sedinam Kinamo Christin Moyowasifza Curry
|
762
|
5.7%
|
-
|
| William Kreml
|
555
|
4.2%
|
-
|
| Kent Mesplay
|
528
|
4.0%
|
-
|
| Total
|
13,267
|
100%
|
-
|
| California American Independent presidential primary, June 7, 2016[6]
|
| Candidate
|
Votes
|
Percentage
|
| Alan Spears
|
7,348
|
19%
|
| Arthur Harris
|
6,510
|
17%
|
| Robert Ornelas
|
6,411
|
17%
|
| J.R. Myers
|
4,898
|
13%
|
| Wiley Drake
|
4,828
|
13%
|
| James Hedges
|
3,989
|
11%
|
| Thomas Hoefling
|
3,917
|
10%
|
| Total
|
37,901
|
100%
|


.jpg)

