2004 Canadian federal election
38th Canadian federal election
The 2004 Canadian federal election (more formally, the 38th General Election), was held on June 28, 2004, to elect members of the House of Commons of Canada of the 38th Parliament of Canada.
| |||||||||||||||||||||||||||||||||||||||||||||||||||||||||||||||||||||||
308 seats in the House of Commons 155 seats needed for a majority | |||||||||||||||||||||||||||||||||||||||||||||||||||||||||||||||||||||||
|---|---|---|---|---|---|---|---|---|---|---|---|---|---|---|---|---|---|---|---|---|---|---|---|---|---|---|---|---|---|---|---|---|---|---|---|---|---|---|---|---|---|---|---|---|---|---|---|---|---|---|---|---|---|---|---|---|---|---|---|---|---|---|---|---|---|---|---|---|---|---|---|
| Opinion polls | |||||||||||||||||||||||||||||||||||||||||||||||||||||||||||||||||||||||
| Turnout | 60.9% ( | ||||||||||||||||||||||||||||||||||||||||||||||||||||||||||||||||||||||
| |||||||||||||||||||||||||||||||||||||||||||||||||||||||||||||||||||||||
 Popular vote by province, with graphs indicating the number of seats won. As this is an FPTP election, seat totals are not determined by popular vote by province but instead via results by each riding. | |||||||||||||||||||||||||||||||||||||||||||||||||||||||||||||||||||||||
| |||||||||||||||||||||||||||||||||||||||||||||||||||||||||||||||||||||||
National results
change| ↓ | ||||
| 135 | 99 | 54 | 19 | 1 |
| Liberal | Conservative | Bloc Québécois | NDP | O |
| Party | Party leader | # of candidates |
Seats | Popular vote | ||||||
|---|---|---|---|---|---|---|---|---|---|---|
| 2000 | Dissol. | Elected | % Change | # | % | Change | ||||
| Liberal | Paul Martin | 308 | 172 | 168 | 135 | -21.5% | 4,982,220 | 36.73% | -4.12pp | |
| Conservative1 | Stephen Harper | 308 | 78 | 72 | 99 | +37.5% | 4,019,498 | 29.63% | -8.05pp | |
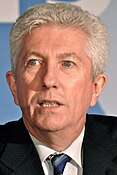
| Bloc Québécois | Gilles Duceppe | 75 | 38 | 33 | 54 | +42.1% | 1,680,109 | 12.39% | +1.67pp | |
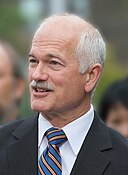
| New Democratic | Jack Layton | 308 | 13 | 14 | 19 | +46.2% | 2,127,403 | 15.68% | +7.17pp | |
| Independent and No Affiliation | 64 | - | 10 | 1 | - | 64,864 | 0.48% | +0.05pp | ||
| Green | Jim Harris | 308 | - | - | - | - | 582,247 | 4.29% | +3.48pp | |
| Christian Heritage | Ron Gray | 62 | * | - | - | * | 40,335 | 0.30% | – | |
| Marijuana | Marc-Boris St-Maurice | 71 | - | - | - | - | 33,276 | 0.25% | -0.27pp | |
| Progressive Canadian | Ernie Schreiber | 16 | * | - | - | * | 10,872 | 0.08% | * | |
| Canadian Action | Connie Fogal | 44 | - | - | - | - | 8,807 | 0.06% | -0.15pp | |
| Marxist–Leninist | Sandra L. Smith | 76 | - | - | - | - | 8,696 | 0.06% | -0.03pp | |
| Communist | Miguel Figueroa | 35 | - | - | - | - | 4,426 | 0.03% | -0.04pp | |
| Libertarian | Jean-Serge Brisson | 8 | * | - | - | * | 1,949 | 0.01% | * | |
| Vacant | 4 | |||||||||
| Total | 1,683 | 301 | 301 | 308 | +2.3% | 13,564,702 | 100% | |||
| Sources: Elections Canada Web Site -- History of Federal Ridings since 1867 Archived December 4, 2008, at the Wayback Machine | ||||||||||
Notes:
"% change" refers to change from previous election
* Party did not nominate candidates in the previous election. In the case of the CHP, which did have 46 candidates in the previous election, the party did not have official status and is not officially compared.
1 Conservative Party results are compared to the combined totals of the Canadian Alliance and the Progressive Conservative Party in the 2000 election.
Vote and seat summaries
change
Results by province
change| Party name | BC | AB | SK | MB | ON | QC | NB | NS | PE | NL | NU | NT | YK | Total | ||
|---|---|---|---|---|---|---|---|---|---|---|---|---|---|---|---|---|
| Liberal | Seats: | 8 | 2 | 1 | 3 | 75 | 21 | 7 | 6 | 4 | 5 | 1 | 1 | 1 | 135 | |
| Popular vote: | 28.6 | 22.0 | 27.2 | 33.2 | 44.7 | 33.9 | 44.6 | 39.7 | 52.5 | 48.0 | 51.3 | 39.4 | 45.7 | 36.7 | ||
| Conservative | Seats: | 22 | 26 | 13 | 7 | 24 | - | 2 | 3 | - | 2 | - | - | - | 99 | |
| Vote: | 36.3 | 61.7 | 41.8 | 39.1 | 31.5 | 8.8 | 31.1 | 28.0 | 30.7 | 32.3 | 14.4 | 17.2 | 20.9 | 29.6 | ||
| Bloc Québécois | Seats: | 54 | 54 | |||||||||||||
| Vote: | 48.9 | 12.4 | ||||||||||||||
| New Democratic | Seats: | 5 | - | - | 4 | 7 | - | 1 | 2 | - | - | - | - | - | 19 | |
| Vote: | 26.6 | 9.5 | 23.4 | 23.5 | 18.1 | 4.6 | 20.6 | 28.4 | 12.5 | 17.5 | 15.2 | 39.1 | 25.7 | 15.7 | ||
| No Affiliation | Seats: | 1 | - | - | 1 | |||||||||||
| Vote: | 1.0 | x | x | 0.1 | ||||||||||||
| Total seats: | 36 | 28 | 14 | 14 | 106 | 75 | 10 | 11 | 4 | 7 | 1 | 1 | 1 | 308 | ||
| Parties that won no seats: | ||||||||||||||||
| Green | Vote: | 6.3 | 6.1 | 2.7 | 2.7 | 4.4 | 3.2 | 3.4 | 3.3 | 4.2 | 1.6 | 3.3 | 4.3 | 4.6 | 4.3 | |
| Christian Heritage | Vote: | 0.3 | 0.2 | 0.3 | 0.9 | 0.5 | x | 0.1 | 0.1 | 0.8 | 0.3 | |||||
| Marijuana | Vote: | 0.2 | 0.2 | 0.4 | 0.2 | 0.4 | 0.1 | 0.1 | 2.4 | 0.2 | ||||||
| Progressive Canadian | Vote: | x | 0.2 | 0.3 | 0.1 | |||||||||||
| Marxist–Leninist | Vote: | 0.1 | x | 0.1 | 0.1 | x | 0.1 | |||||||||
| Canadian Action | Vote: | 0.3 | 0.1 | x | x | x | 0.1 | 0.1 | ||||||||
| Communist | Vote: | 0.1 | x | 0.9 | x | x | x | |||||||||
| Libertarian | Vote: | 0.1 | x | x | x | |||||||||||
| Independents | Vote: | 0.3 | x | 4.6 | x | 0.3 | 0.1 | 0.2 | 0.1 | 0.6 | 15.7 | 0.3 | ||||
Source: Elections Canada
References
changeNotes
General
- Dornan, Chris; Pammett, Jon H. (2004), The Canadian general election of 2004, Dundurn Group, ISBN 1-55002-516-3


